The difference between Beta and Alpha?
The market portfolio is a unique animal. It provides an opportunity for diversification as well as ruin. Markets shift direction at short notice and while rising tides raise all boats, the true performance of a fund manager is determined when markets take a turn for the worse. How does that relate to our original question? The difference between Beta and Alpha?
From a security and portfolio selection point of view we have two challenges. When the market goes up, our performance as fund managers is measured by how we move with respect to the market. When the market goes down our performance is measured by how we don’t move with the market. If we just focused on matching market performance, we will do well when markets do well but we run into trouble when there is a downward shift in the market portfolio.
Ideally we would like to explore a model where when markets go up positions go up and when markets go down, our portfolios don’t go down. This means that if we were to create such a model, that model should have two key components of performance. A market dependent performance and a market neutral performance.
When markets are rising, our market dependent performance factor should contribute a portion to our return. The market neutral component, which is independent of market performance will also contribute to our performance since it is independent of market linked return. But that contribution is going to be independent of direction of the market.
When markets are declining the market neutral performance should dominate our market dependent performance. If this holds true irrespective of how much markets decline, we should still be able to offset that drop by our market neutral contribution.
One way to measure market dependence of a security is through Beta. Beta assess the degree of co-variance between a given security and the market portfolio. How much do prices of a given security move when market prices move? In simpler terms it can be defined as that portion of security’s performance which can be attributed to market movement. Just to be clear – Beta is not a proxy for risk – it is a proxy for price change on account of a change in market portfolio prices. This is a common misconception in academic text books but its not true. Beta is a relative performance measure, not a risk measure, contrary to popular opinion.
We first met Beta when we discussed the CAPM model. The Capital Asset Pricing Model takes many shapes, the most common and simplified version is:
Security return = R = Beta x Market Return
This is a simpler formulation and we will label this return as the Beta Return and use this in our portfolio models.
A more detailed formulation is
R = Risk free rate + Alpha + Beta (Market return – risk free rate).
You may also see the same formulation without the risk free rate. The second formulation basically says that the return on any given security is driven by three components.
- The risk free rate.
- The return not attributable to market movements. Represented by Alpha in the equation above.
- The return attributable to market movements. Represented by Beta times the excess market return over the risk free rate.
The return attributable to market movements has two drivers. The excess return generated by the market over the risk free rate. And Beta – the co-variance of a given security with respect to the market portfolio. We will label this return calculated by the more comprehensive model as the full return.
If we take the actual realized return recorded for a security and subtract the projected Beta return from it, the resulting value is the excess return not attributable to changes in the price of the market portfolio (the index). This excess return is what we label as Alpha.
Ignoring the risk free rate and full return, when we speak about market neutral returns dominating the market return, we want a security’s Alpha to dominate the Beta return.
Let’s take a quick look at a simple but contrived example.
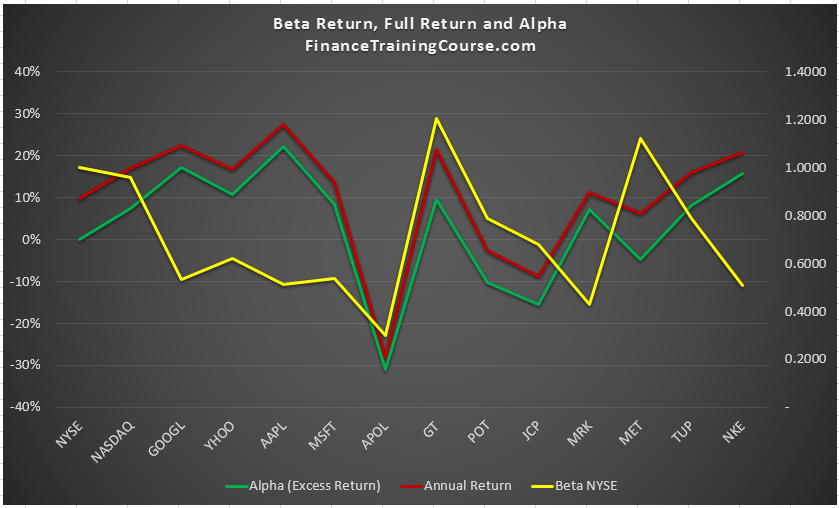
The graph above presents Alpha and Beta values and their relationship with annual return for the securities in our portfolio universe. In the figure above the neon green line represents Alpha with respect to NYSE, the red line represents average annual return between Dec 2008 and Oct 2016 and the yellow line represents Beta calculated with respect to NYSE (the DJIA Index).
Can you see any relationship in that image?
The tech sector (GOOGL, YHOO, AAPL, MSFT) shouldn’t relate too well with NYSE and therefore have relatively low Beta’s and high Alphas. It would be interesting to repeat this calculation with Beta calculated with respect to NASDAQ and observe if the reverse is also true.
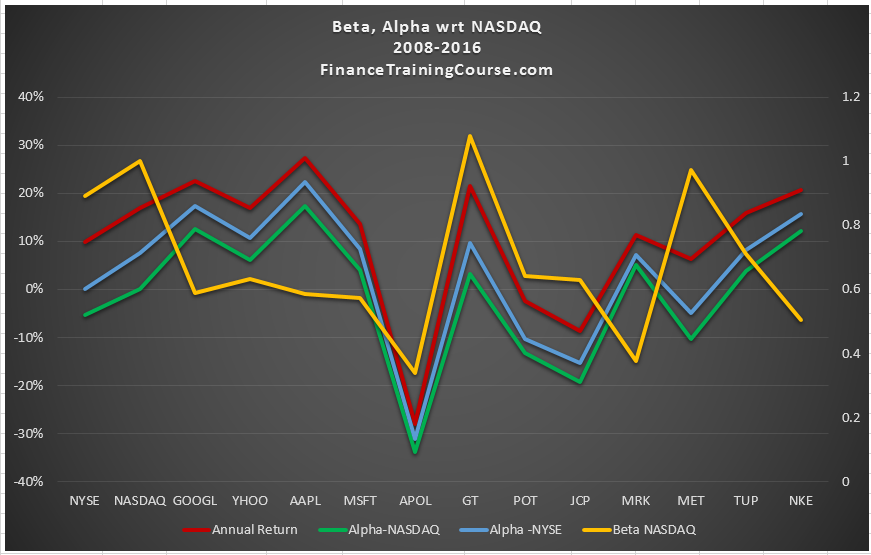
When we plot that curve we clearly see that the NASDAQ Alpha for technology industry securities is clearly lower than the NYSE Alpha for the same securities. This newer Alpha is better representation for these securities because it is free of the incorrect index effect. Having said that the revised Alpha is still quite respectable for the securities in question.
The NYSE listed companies have relatively higher Beta’s and lower Alphas with two exceptions – APOL and JCP? Think about it for a second, why is that?
If Alpha represents the excess return not attributable to market returns, it should be independent of market movements. It can also be used as a proxy for a security or industry specific return which is driven by internal factors specific to that security.
In our case we are using the incorrect index since DJIA/NYSE is not a good proxy for the technology industry in general. That may be one of the security specific factors (but not the only one) that may explain the relatively higher Alphas for tech sector stocks in our sample.
If historical performance and correlations hold, such a portfolio, our alpha dominant variation, should not just beat market performance when markets rise but will also beat the market portfolio when markets decline. Because Alpha is market neutral when markets take a turn for the worse, the security Alpha should generate a higher return than the negative Beta return generated due to the market down swing.
Would this relationship hold for the portfolio we have been working with? We have the initial Alpha and Beta estimates that we have just presented above but do we need any additional information.
To run this analysis we need to estimate Alpha and Beta estimates for our security universe. We have two alternate approaches for calculating Alpha with respect to an index. We have shared the Alpha estimates with respect to NYSE, but we also need Beta and Alpha estimates with respect to NASDAQ.
In our next lesson we will take a look at calculating Beta, calculation Alpha and modifying our portfolio optimization objective function to first favor Beta, then Alpha and then values between the two. Our objective is to see how our Alpha and Beta dominance performs when confronted with trends in equity prices within our data set.