As part of our case discussion in the Portfolio Optimization course, we proposed a simple question to eighteen odd apprentice Portfolio Managers in the class. We understand how to calculate portfolio management Alpha and Beta. But do we understand how to put these two metrics to work? More importantly what is the intuition behind actual realized portfolio performance and a Beta or Alpha driven portfolio strategy. We have covered the topic as part of literature review but what evidence do we have to back up our intuition? Also what would be a reasonable or robust measure of performance evaluation of strategies over time?
2012 – 2016 a short case study
To answer these questions we proposed a simple experiment.
Using our stylized portfolio management data set we first create and allocate portfolios using a collection of strategies. Then, evaluate their performance using a forward looking data set. A forward looking dataset is a portion of the historical dataset that we do not use when training the model. So for instance if we allocate positions to a portfolio on 1st December 2008 and then review performance on 15 November 2012 the training data set includes prices and metrics from the dates 1st December 2008 to 15 November 2012. The forward looking data set would include price and metrics beyond 15 November 2012.
In this instance we set up the problem so that allocation occurs using prices and metrics from the 1 December 2008 to 15 November 2012 dataset. Performance evaluation would occur using prices from 15 November 2013, 2014 and 2015. Prices that the model was not aware of so we could see how our original allocation strategy performed over a period of time. Our so called forward looking data set.
Portfolio management Alpha and Beta strategies
For our allocation strategies we created the following pool
- Max Beta. Subject to all portfolio constraints maximize portfolio Beta – Strategy A
- Min Beta. Subject to all portfolio constraints minimize portfolio Beta – Strategy B
- Max Alpha. Subject to all portfolio constraints maximize Alpha – Strategy C
- Min Alpha. Subject to all portfolio constraints minimize Alpha – Strategy D
- Max Beta, Max Alpha. Subject to all portfolio constraints maximize both Beta and Alpha – Strategy E
- Min Beta, Max Alpha. Subject to all portfolio constraints minimize Beta and maximize Alpha – Strategy F
Remember that this is a contrived example. We only have 12 possible positions and we limit them to equities only at this point. So the portfolios and the results are not going to deviate too much from each other. When we add currencies, commodities and bonds to the mix and the universe expands to 50 odd positions, we will see some interesting variations. But till then, this exercise will serve as a first introduction to our strategy evaluation framework.
Our portfolio model works with 12 position in US equities that include Google (Alphabet), Yahoo (pre-sale), Apple, Microsoft, Apollo Education, Good Year Tires, Potash, JC Penny, Merck Pharma, Met Life, Tupperware and Nike. A mix of technology, education, demographics driven cyclical businesses, retail and financial services.
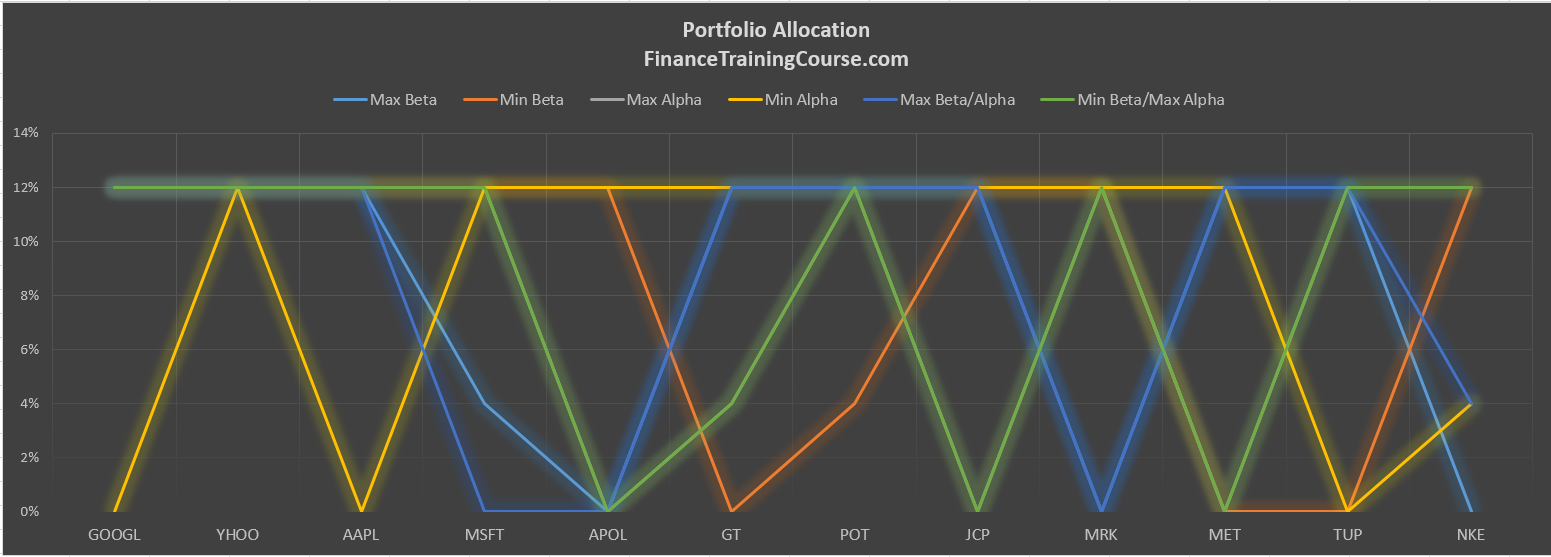
We create the design of the strategy pool to study the impact of Alpha and Beta in isolation and in combination with each other. While we explored this theme earlier when we introduced the concept of holding period return and performance evaluation, this time the design explicitly focuses on the relationship between Alpha and Beta.
Evaluating results of portfolio management Alpha and Beta allocation strategies
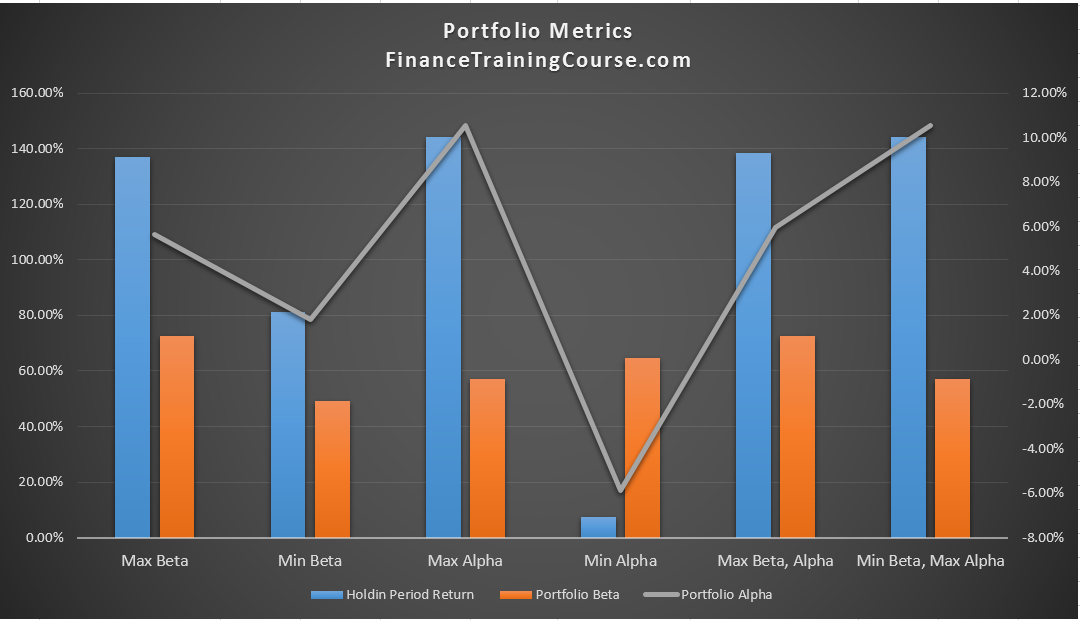
To evaluate the results of our allocation we do an in period evaluation that evaluates performance of the six strategies as at 15-November-2012. And three forward looking evaluations to assess the performance as at 15 November 2013, 15 November 2014 and 15 November 2015.
Portfolio constraints included our standard 12% limit on a single position, no short sales and full allocation. No risk or return requirements were specified. The portfolio was assumed to be re-balanced every six months in order to hold true to the 12% allocation limit. All dividends were reinvested into the portfolio.
The annual re-evaluation using the forward looking data sets shows some interesting trends.
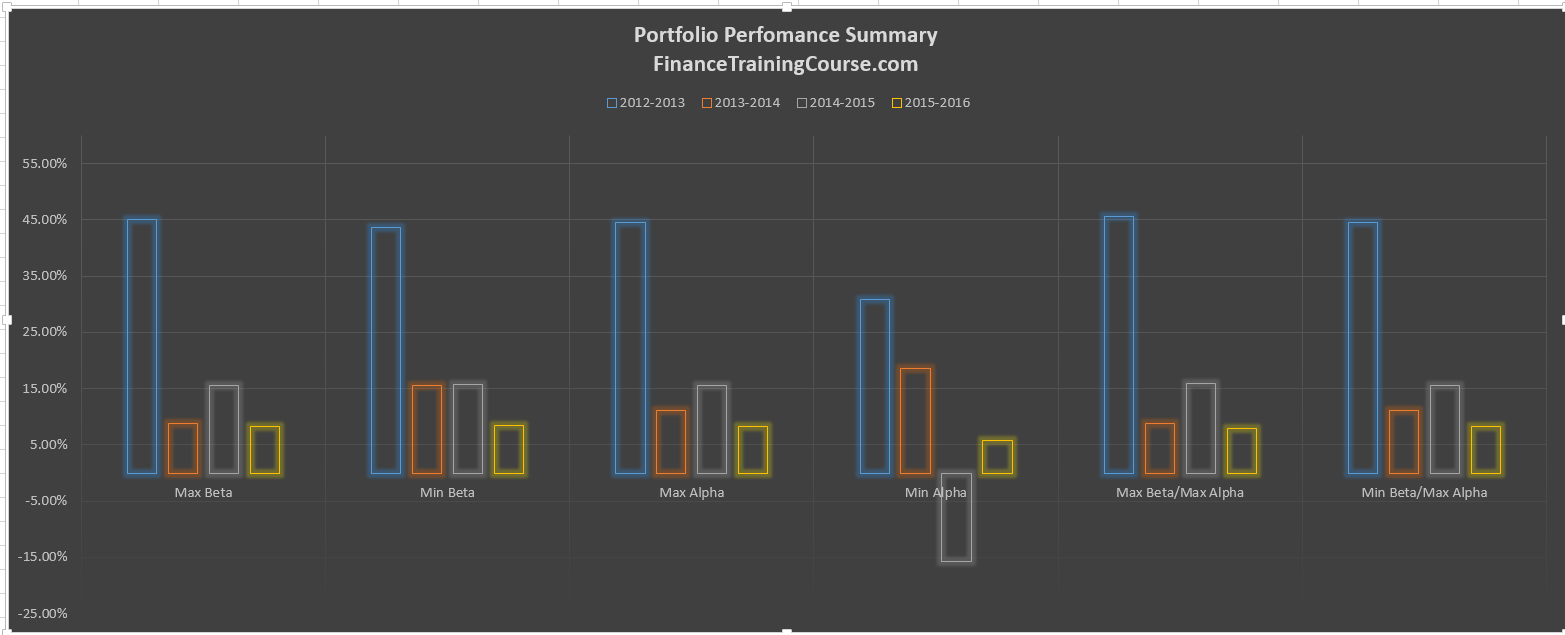
If you are a seasoned portfolio manager you can guess the results. A strategy that maximizes Alpha should dominate all other possible combinations. Not just in a given year or with the original data set but also across the forward looking data set – the data set the model hasn’t trained on. The surprise though was how quickly we sidelined Beta in our class discussion. Before you take that to heart remember Alpha is calculated as excess returns or security specific return using Beta as an input. So Beta is implicit in this analysis.
The real test however for this model and its ability to test both robustness and model stability, is when we roll it out over our 50+ security universe. The 12+ model is just an illustrative, contrived test case we have use to dry run the model? Do you think the same results will hold across a larger data set?