Portfolio Management. Calculating Beta Alpha.
Beta measures the covariance of a security with respect to a market index. In our expanded data set, we have now added currencies, bonds and commodities. In addition to the two equity market based index for NYSE and NASDAQ, we have also created three new indexes. Equally weighted indexes for currencies, commodities and bonds.
Our plan in this session is to calculate Betas not just for the original market index but also for the three new indexes. In order to experiment and test out our investment thesis we are also going to go ahead and calculate the Beta for Gold and Oil from our commodity portfolio. The reason for the new Betas is to see if we can discover any market relevant relationships between a given asset class such as bonds, commodities, currencies and a security in our investment universe.
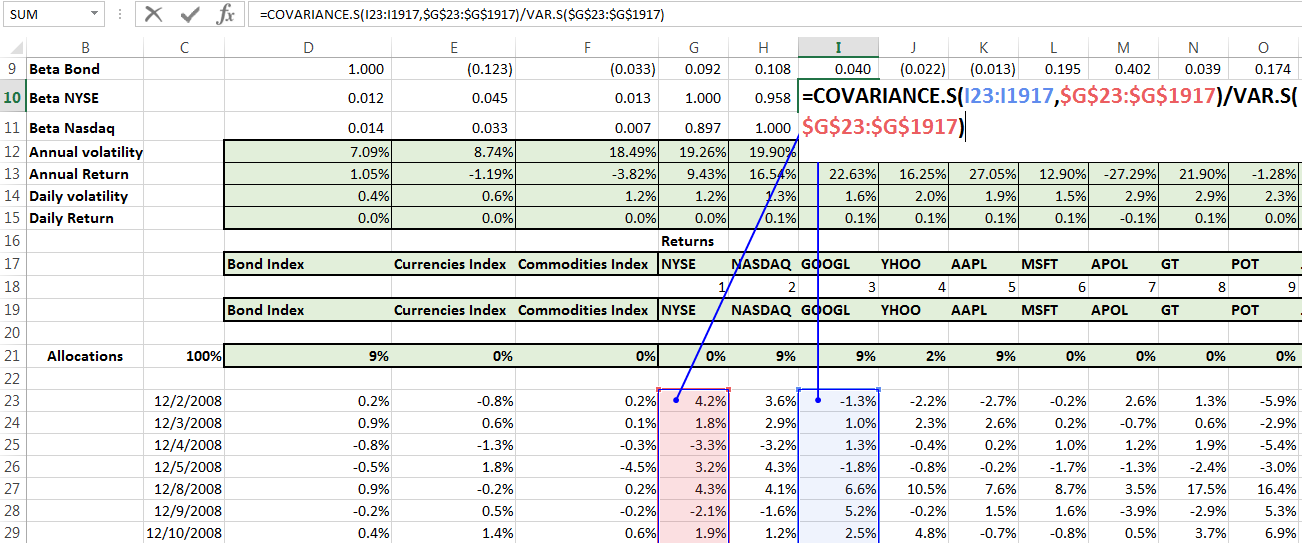
The formula we are going to use for calculating Beta is:
Beta = Covariance (Security return series, Market Index) / Variance (Market Index)
For instance Beta of Google wrt to NASDAQ would be:
Beta (Google / NASDAQ) = Covariance (Google return series, NASDAQ return series) / Variance (NASDAQ return series)
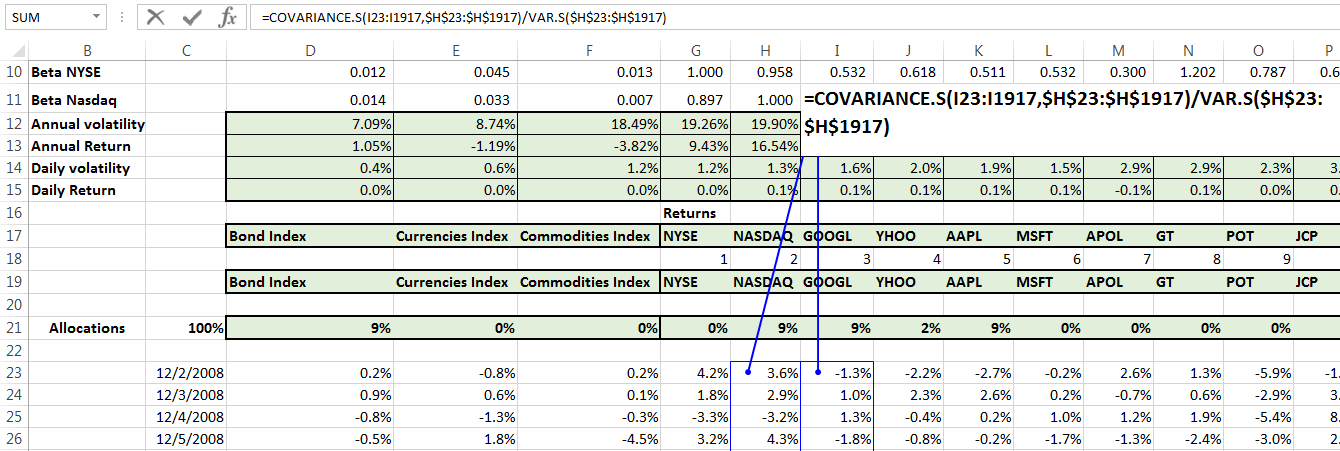
If we wish to calculate Google’s Beta wrt to NYSE, all we would need to do would be to switch the return series to NYSE and we will have Google’s Beta wrt NYSE.
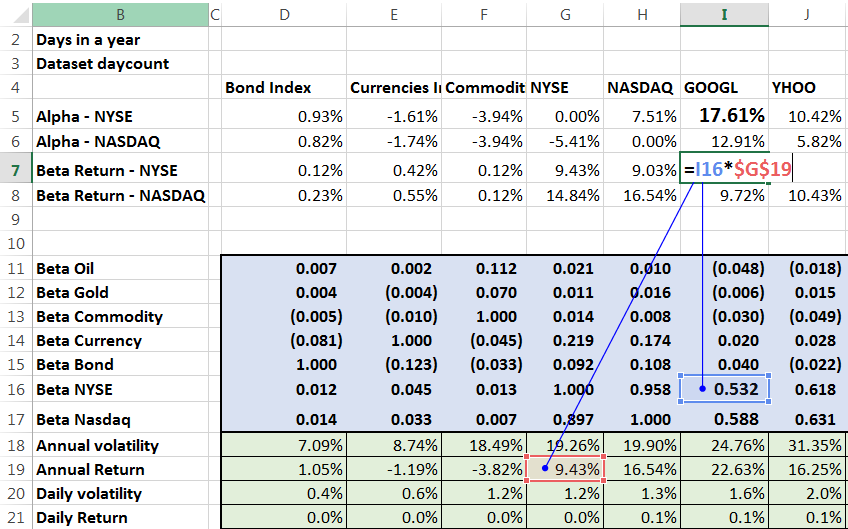
Go ahead and calculate the Betas first for the entire universe of securities with respect to the five indexes – Bonds, currencies, commodities, NYSE and NASDAQ. Using the formula we have just described above. After the five index, also calculate the Beta for Gold and the Beta for Oil (WTI). If you need assistance for a more detailed treatment see calculating Beta wrt to a market index.
When you are done you should be able to see a table like this for the 38 securities (5 index, 3 currencies, 7 bonds, 12 equities and 11 commodities) in our investment universe. For NYSE and NASDAQ results are apparent. But for the other 5 indexes we were primarily interested in discovering interesting relationships.
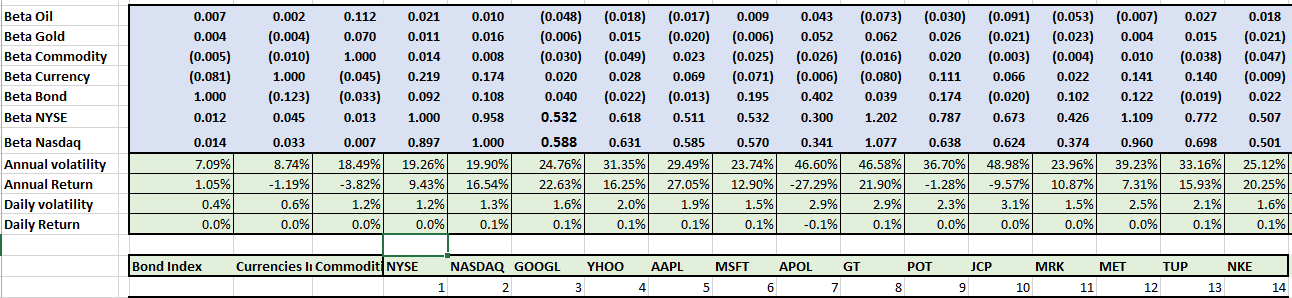
Now that we have the numbers we do a quick plot in Excel to eyeball the results.
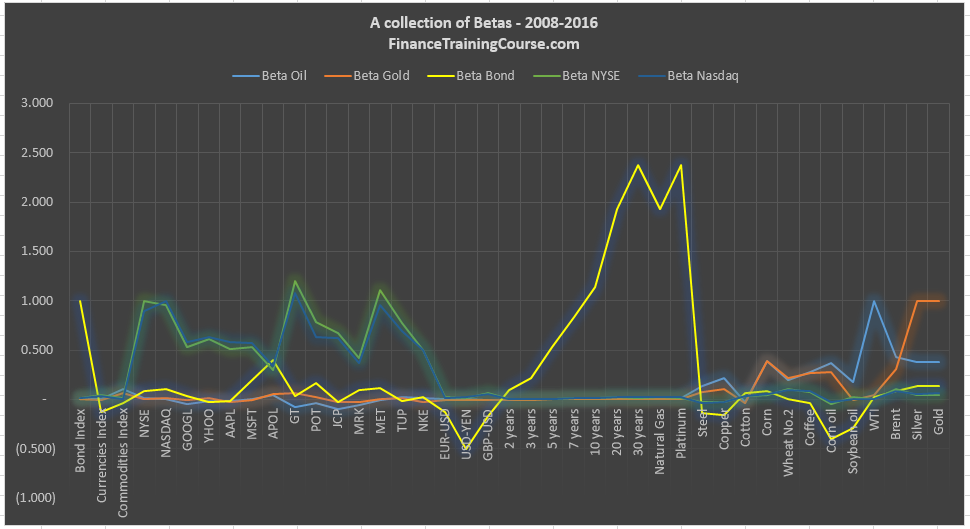
A few things that immediately stand out.
As expected equities relate well to NASDAQ and NYSE. But the two market indexes have no visible relationship with currencies, bonds or commodities. The bond index has some connections with the one troubled security in our portfolio and surprisingly with both Natural Gas and Platinum on the commodity front. Which is a surprise for which we don’t have an immediate explanation. The bond index also has an inverse relationship with the USD-JPY pair, as expected as rates go high, the USD tends to do well against the Japanese Yen.
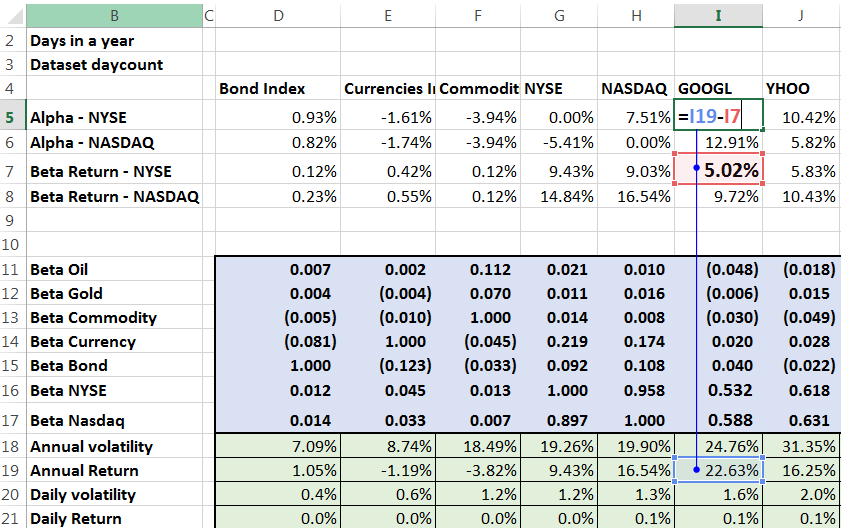
Once we have the Beta values, calculating Alpha is a two step process.
- Calculate the projected Beta return with respect to the index. Beta return is Beta for the security times the index return.
- Subtract the Beta return from the realized return for the security to estimate the excess return.
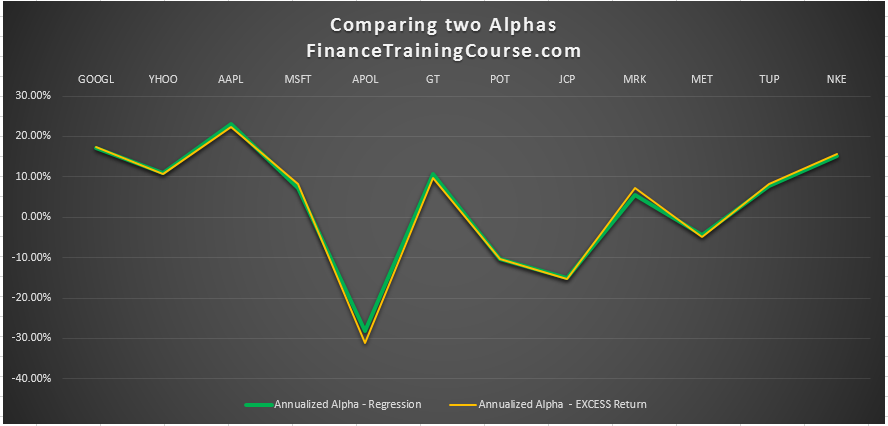
This approach and method is an approximate method. A more accurate process for estimating alphas using regression is also available. Typically the differential between the two estimates can be ignored for most portfolio optimization worksheets. That certainly appears to be the case for our universe of securities.
Continuing with our example of Google we first go ahead and estimate the Beta return for Google using NYSE.
And then the excess Alpha return for Google wrt to NYSE using the above approach.
Go ahead and repeat the process for all securities in our investment universe. Once you are done plot both Alpha and Beta returns together.
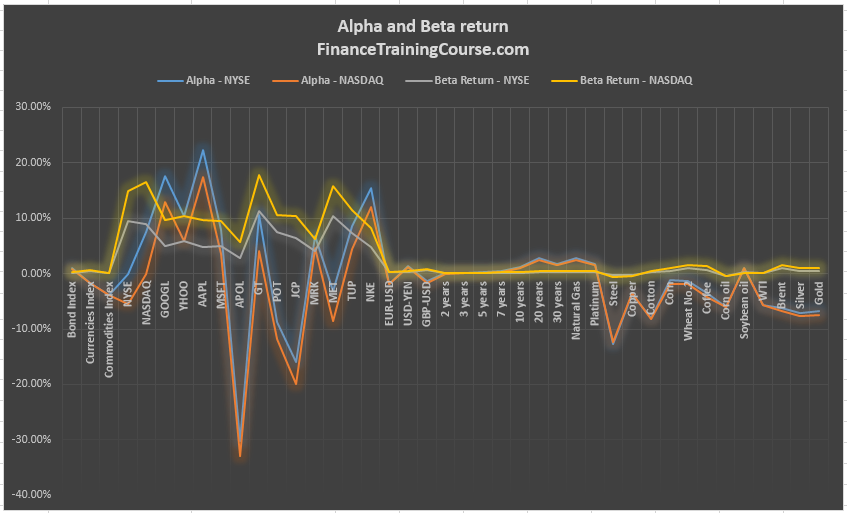
How would you interpret this graph? What does it show us? Is there a different way of looking at the same data with a different lens that can help? What does it tell us about interpreting the two investment metrics and putting them to work?