What is the first image or thought that comes to your mind when you hear the term Portfolio management? Making money trading shares? Figuring out allocation of investments across a group of selected securities? Changing market prices and volatility? Capital loss? Diversification? Consistent returns? Complex mathematical and Excel models? Warren Buffet?
If you are a finance student or an individual with a pool of savings who is trying to figure out how and where to invest his nest egg, it is important to understand the basics of portfolio allocation, management and optimization. It doesn’t matter what the size of the pool is, you have to answer the same questions. While the Excel implementations of portfolio models may look a little daunting the core of the subject is based on one basic principle. Managing risk and return.
At the start of this course, we start with a very simplistic approach to measuring risk and return. As we get more comfortable with the models, we revisit our definition and add more relevant metrics. While our model is built around balancing the risk and return trade off, we will quickly add more constraints and dimensions.
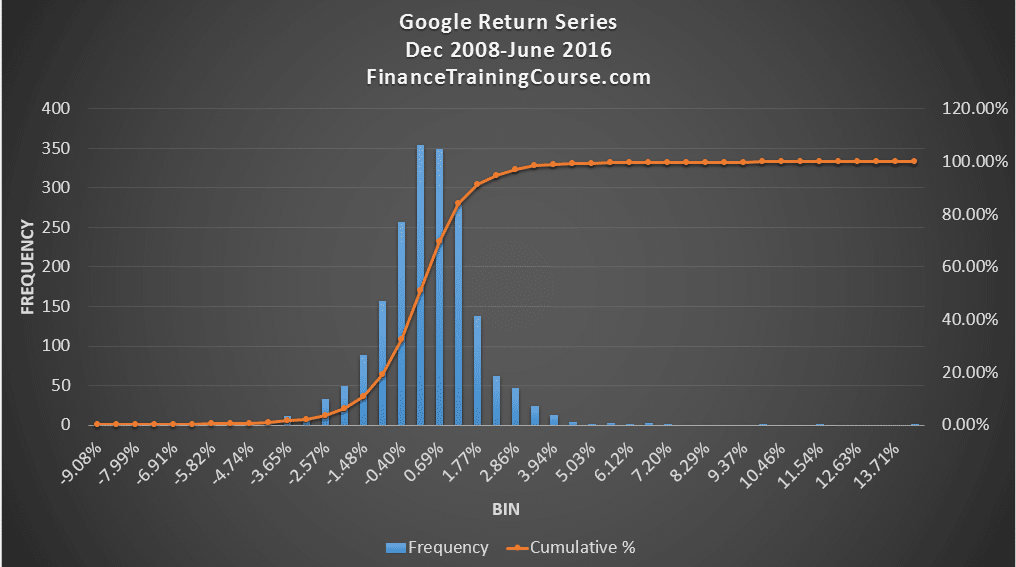
In our initial models risk is measured by the daily standard deviation of price. We prefer to use volatility or its preferred shorter form, vol. From a modeling point of view volatility is a reasonable proxy for price uncertainty. If you want to build a model for forecasting price changes over a period of time, volatility of returns provides an acceptable comprise. It is a metric which is easily measurable, easily explainable and with some adjustments tends to do well under typical market conditions. If we understand the distribution of daily price changes we can use it to predict price behavior.
The model fails under extreme conditions but we have a few tricks that partially address the challenge. Towards the end of the course, we will come back and question the assertion that is volatility a good proxy for risk? Is volatility risk? Till then it will serve as our measure of risk.
Return is measured as the average change in daily prices and refers to the average daily return. Depending on our holding period and the focus of our analysis, we can measure both metrics over a day, a week, a month or any combination up to a year.
The trade off is expressed in terms of return per unit of risk. This single metric combines both dimensions of our decision making and is the starting point for our portfolio optimization conversation.
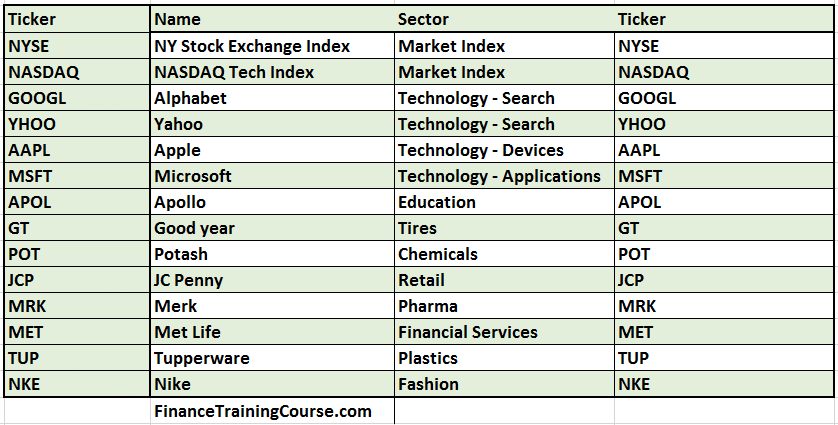
We begin our work with a simple universe of security that we will use to select our portfolio. The initial universe includes the following candidates.
Portfolio management. The market portfolio
How should we assess the performance of the portfolio manager?
How about comparing the performance of a managed portfolio with a portfolio that is not managed at all.
Do we have a candidate? It’s called the market portfolio. A broad based selection of stocks from the market that reflects the market’s overall performance. The market portfolio doesn’t require any active management just some rebalancing of positions at preset frequencies to reflect changes in prices and weights.
In most markets, the market portfolio is represented by the market Index. DJIA and NASDAQ tech for Dow Jones NYSE and NASDAQ respectively.
If an active fund manager adds value by his investment management skills he should be able to consistently beat the market both in terms of risk and return. We can use our return per unit of risk metric subject to a minimal return over a multiple time horizons as a filter. If we apply the filter we will find that while a number of given investment managers may beat the market in any given year, it is difficult to find managers who do it on a consistent basis, year after year.
For performance assessment purposes it is therefore important that we identify a few candidates for the market portfolio. We also need a measure or indicator that would allow us to track how much variability in a given portfolio can be associated with movements in the market portfolio. As well as what portion of that return is not attributable to returns on the market portfolio.
Armed with these two tools, we would then be able to measure the performance of our selected portfolio against market performance.
Now that we have this sorted out, let us take a quick look at the imagery that came to our mind when we first spoke about the topic of portfolio management.
Figuring out allocation of investments across a group of selected securities using Excel models. How do you determine what is the right allocation across a group of selected securities. The answer depends on what you want your portfolio to achieve. Maximize return, minimize risk or find the optimal balance between risk and return. Within the optimization world, we refer to this objective as the objective function.
An optimization model may use a tool like solver to walk across a range of possible combinations to find the answer that maximizes your chosen objective function.
Changing market prices and volatility. Market conditions change on a day to day basis. While value investor and traders may take the long term and not be too concerned by day to day volatility, momentum investor live off the swings caused by daily price volatility. Still sudden downward swings in prices because of market over reaction to bad news can sometime uncover hidden value opportunities. Irrespective of your investment style, volatility is a useful metric to keep your eyes on.
Capital loss. The ultimate objective of an experienced fund manager is generating excess returns while preserving capital. Much more difficult than it sounds.
Diversification. One way of reducing portfolio volatility is to combine securities with low or even better negative correlations. This creates an opportunity for us to improve returns while reducing volatility.
Consistent excess returns and Warren Buffet. Consistent excess returns are the holy grail of the investment and portfolio management world. Warren Buffet is the flag bearer of the value style of management that focuses on buying securities at prices significantly less than what they are worth and holding on to them till the market realizes their full potential.
Portfolio management assignment – Day one.
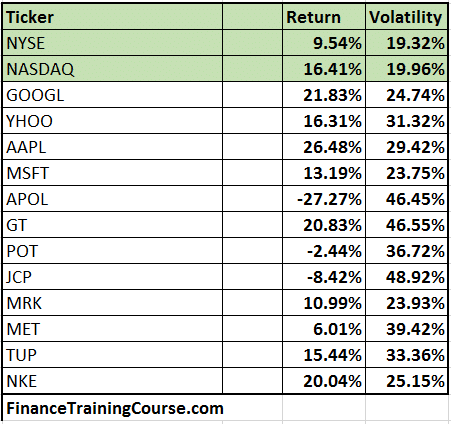
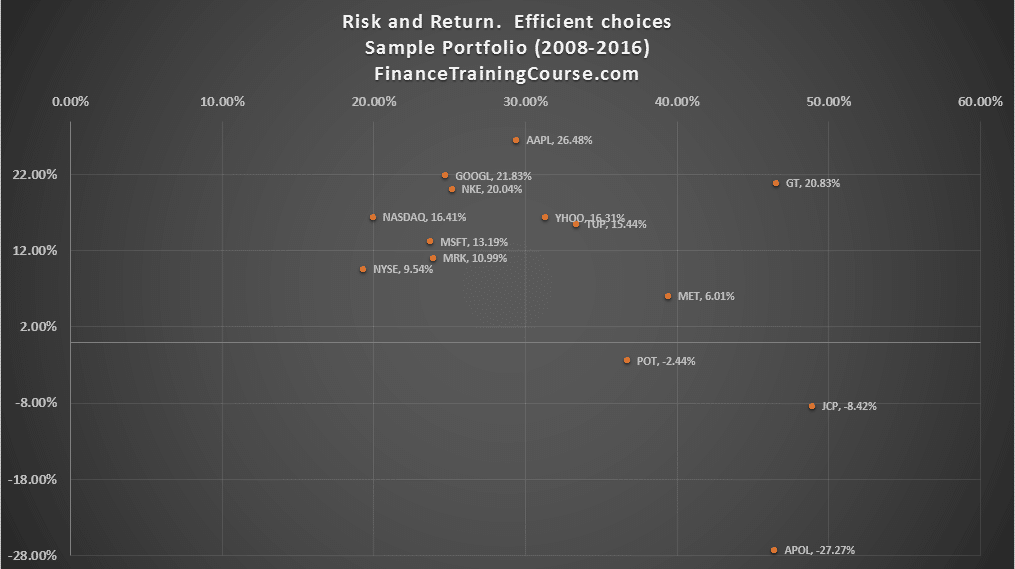
To measure portfolio return and risk we need estimates for both of these items for our universe of investment securities. Our first assignment is to use the given market price data set and use it to calculate risk and return for a small universe of securities. To keep things simple we start initially with just equities and then add other asset classes. Once we have risk and return for individual securities, we can then calculate portfolio risk and return. Our final step would be the plot of the risk and return combined metric, return per unit of risk, which plots the portfolio risk and return for different values of portfolio allocation.
Portfolio management assignment – Day Two.
Day two we introduce the concept of Beta and Alpha. Beta is our proxy for the part of the return of a given security that can be attributed to market movements. We use Beta to predict and forecast security returns based on expected market movements. We understand that our projections may only be partially successful in terms of predicting actual return but we have a model that can be used for performance attribution.
Beta also makes it possible to calculate Alpha, the return not attributable to market movements, also known as the excess return. Between Alpha and Beta we should be able to cover a range of investment styles.
Portfolio management assignment – Day Three
Day Three we add additional asset classes beginning with one commodity, three currencies and a few treasury bonds. We repeat the security and portfolio metric calculations.
Portfolio management assignment – Day Four
Tracking, matching and beating the Index. We use Excel solver, our security and portfolio data set and metrics to try and see if we can beat the return on the market index portfolio. While a market index may have hundreds of contributing securities, our objective is to replicate the index with a minimal set. Our initial approach is a single period match, followed by a multi-period attempt using solver. We also review tricks and tweaks of Solver. These include coaxing Solver towards the optimal solution, hacking, tweaking and improving the objective function. Return and risk over a single time horizon as well as multiple time periods.
Our second application is optimizing the portfolio of a life insurance company by beating the bond index. We add two new constraints. 80% of the investment portfolio is invested in a bond index. The remaining 20% can be invested in all other investment classes. The return of the portfolio has to be higher than the bond index, ideally with lower volatility.
Portfolio management. Day Five – Case discussion
For our class discussion we have picked up two HBS cases. Numeric LP and Performance assessment and measurement. We will evaluate different investment styles and performance measurement tools used by portfolio managers and institutional investors.
Portfolio management. Day Six – Group presentation
Using our data set and optimal portfolio as a client portfolio each group experiments with adding an investment security to the portfolio and examining the impact of the new addition on portfolio risk, return, Alpha and Beta.
A high level outline of discussion and class work from day one of EMBA Portfolio Management and Optimization run at SP Jain’s Dubai campus from November 5th – November 10th.