This is the second in the series on the calculation of Pre-settlement Risk (PSR) & Potential Future Exposure (PFE) for FX derivatives. We extend the model we used to calculate the PSR & PFE risk measures for a call option to a forward contract and a Target Redemption Forward (TARF) transaction.
1. Long Forward
a. Pre-settlement risk (PSR)
The buyer has entered a forward contract on 30-06-2017 to exchange USD 10,000 for JPY at the forward rate of 110 units of JPY for one unit of USD at the end of one year. The domestic risk free rate is 0.128% (JPY LIBOR) and the foreign risk free rate is 1.732%.
The current value of the forward contract on 30-06-2017 is:
f = S0e-rfT – Ke-rdT = JPY -5,588.63
On this date, the counterparty is in the money whereas the purchaser of the forward contract is out of the money. Hence, the PSR for the purchaser is nil.
What if the strike/ exercise rate was 109 instead of 110?
In this case, the current value of the forward contract on 30-06-2017 works out to JPY 4,398.58. At this point in time, the forward contract holder is in the money and is subject to pre-settlement risk if the counterparty were to default.
PSR is calculated as the current value of the forward contract. We may add the worst case increase in value of the forward over a 10-day holding period to represent the delay in re-covering the original position in the open market. Worst case increase is calculated by applying a VaR approach to the return series of forward values calculated using the historical risk free rates data. The PSR works out as follows:
b. Potential Future Exposure
i. Simulate spot exchange rates
As for the call option, the first step is to construct a Monte Carlo simulation model for simulating path dependent spot exchange rates over the next twelve month period:

The risk free rates term structure and implied volatility used in the model are assumed to remain unchanged from what they were on the current valuation date.
ii. Calculate forward contract value
The forward contract value for the current valuation date and on each subsequent month end using the forward contract pricing formula with the corresponding simulated spot is calculated:
1000 simulations are run and the future forward contract values for each time step are captured in a data warehouse.
iii. Calculate PFE
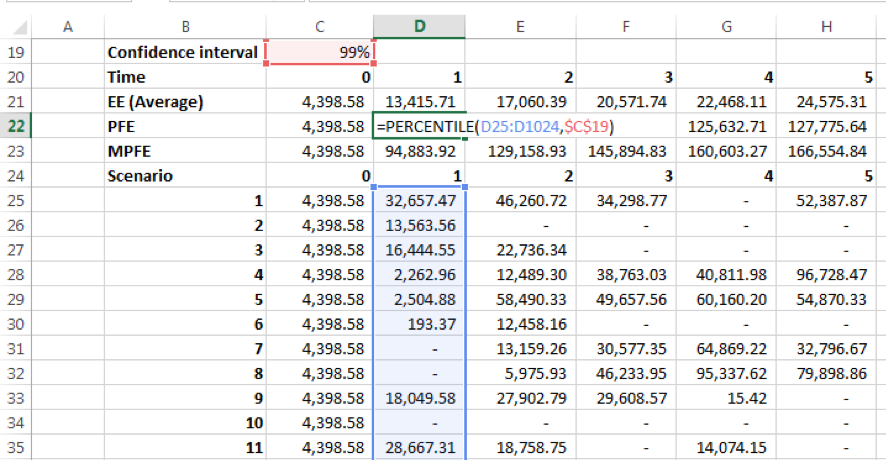
For a given future date, the PFE is calculated as the upper first percentile (99% confidence interval) of the simulated values for a given future date; MPFE is the maximum simulated value across all runs; and the expected exposure is the average value across all runs.
Estimates of counterparty credit risk for the forward contract as of 30-06-2017 are given below:
2. TARF
a. Pre-settlement risk (PSR)
Finally, we look at our TARF transaction. The TARF structure we have is a series of 12 long forward contracts to purchase USD for JPY with maturities ranging from 1 month to 12 months. The strike exchange rate for all legs is 110 with notional of USD 10,000. The issue date is 30-06-2017. The contract has a knock out feature such that it will terminate prior to maturity if the accumulated position intrinsic value at the end of a transaction leg exceeds JPY 20.
i. Obtain risk free rates
The risk free rates as of 30-06-2017 are as follows. Note: JPY is the domestic / premium currency and USD is the foreign currency:
| LIBOR Tenor In years |
JPY | USD |
| – | -0.015% | 1.064% |
| 0.0192 | -0.015% | 1.118% |
| 0.0833 | -0.027% | 1.171% |
| 0.1667 | -0.010% | 1.210% |
| 0.2500 | -0.006% | 1.262% |
| 0.5000 | 0.022% | 1.432% |
| 1.0000 | 0.128% | 1.732% |
ii. Calculate forward exchange rates
Given that the spot exchange rate, S0 is 111.21, the forward exchange rates, calculated as F0 = S0e(rd-rf)t, for the next twelve months are as follows:
| T | F0 |
| 0.0833 | 111.20 |
| 0.1667 | 111.19 |
| 0.2500 | 111.17 |
| 0.3333 | 111.16 |
| 0.4167 | 111.15 |
| 0.5000 | 111.09 |
| 0.5833 | 111.07 |
| 0.6667 | 111.05 |
| 0.7500 | 111.03 |
| 0.8333 | 111.01 |
| 0.9167 | 111.00 |
| 1.0000 | 110.84 |
Note: In order to calculate the forward exchange rates for the interim tenors for which risk free rates are unavailable we have not interpolated consecutive rates. For the purpose of this post, we have simply used the risk free rates for the tenor less than or equal to the tenor for which forward rates are required, e.g. for tenor 0.3333 we have used the risk free rates for the tenor 0.25 to calculate the forward exchange rate for month 4.
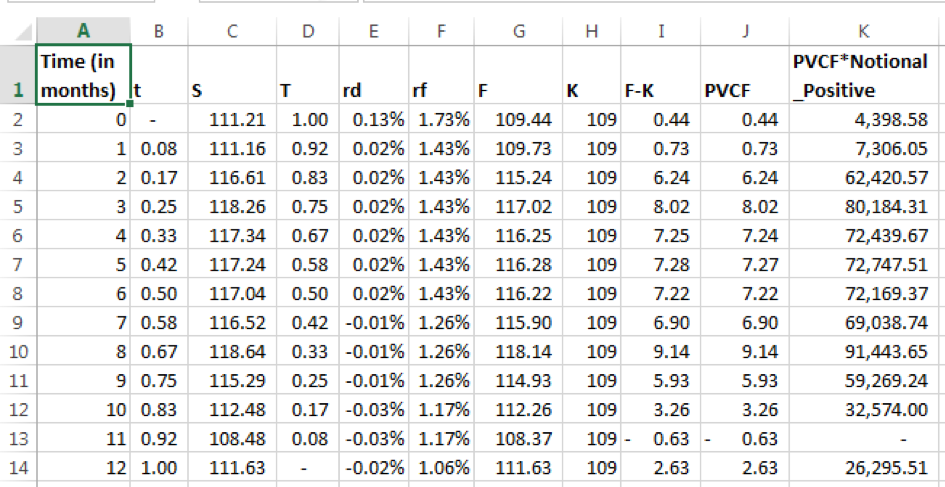
iii. Calculate PSR
For determining the PSR for TARF we follow the same steps as used for calculating the PSR for a call option.
- Build a model for calculating the TARF value.
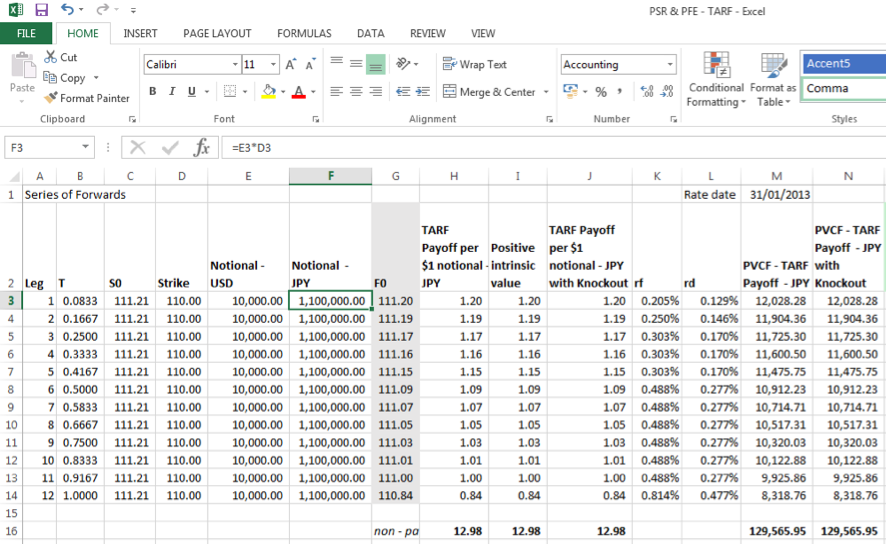
The screenshot above shows the TARF value for risk free rates data point 31-01-2013.
2. Determine a series of TARF values using the risk free rates historical data and assuming a constant tenor, volatility and spot price for each data point.
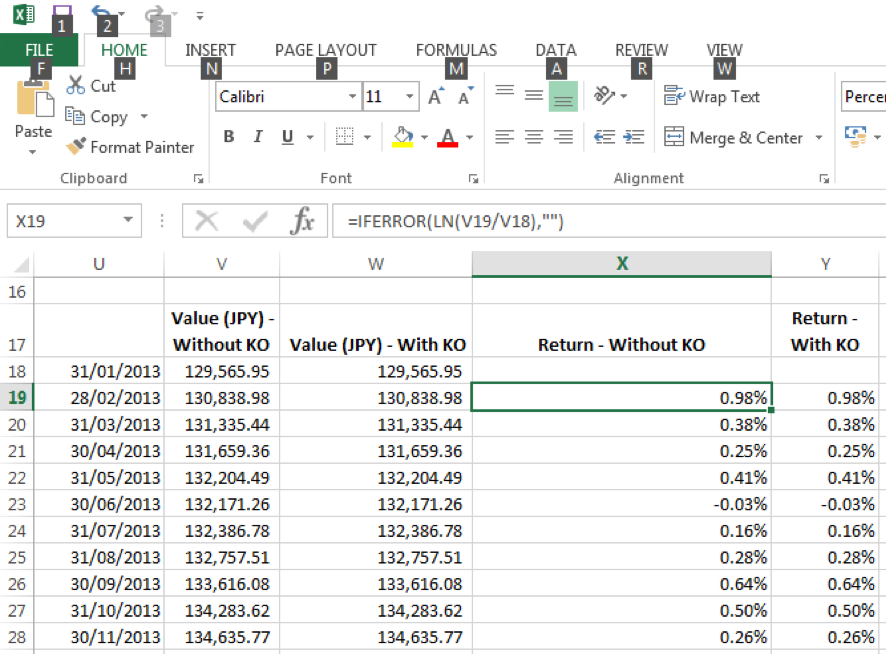
The screenshot shows the data table of TARF values and corresponding returns for each risk free rates data point with and without considering the knock out feature.
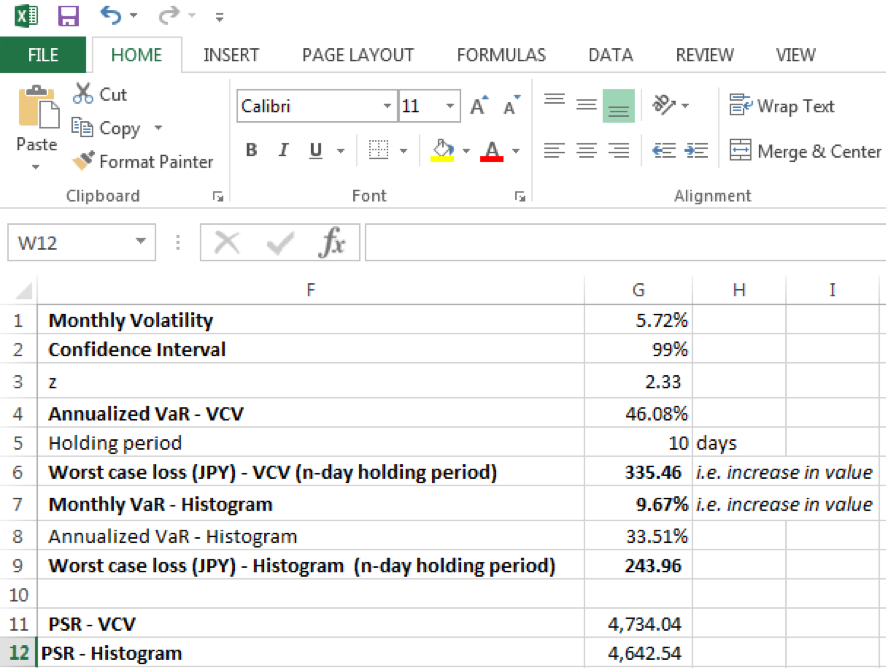
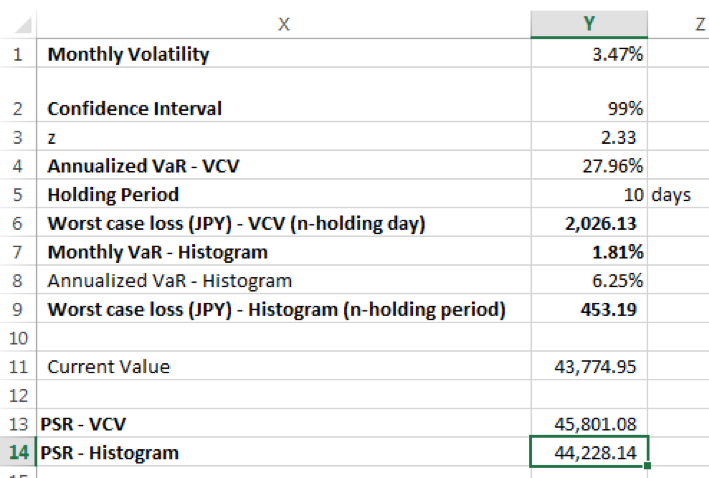
3. Calculate the maximum increase in value over a pre-specified confidence interval for a given holding period.
4. PSR is equal to the current value + the maximum value increase, floored at zero.
b. Potential Future Exposure (PFE)
Using our Monte Carlo simulation model, but this time using the non-path dependent series of simulated spot exchange rates we build our model for determining the potential future exposure at a given future date for the TARF.
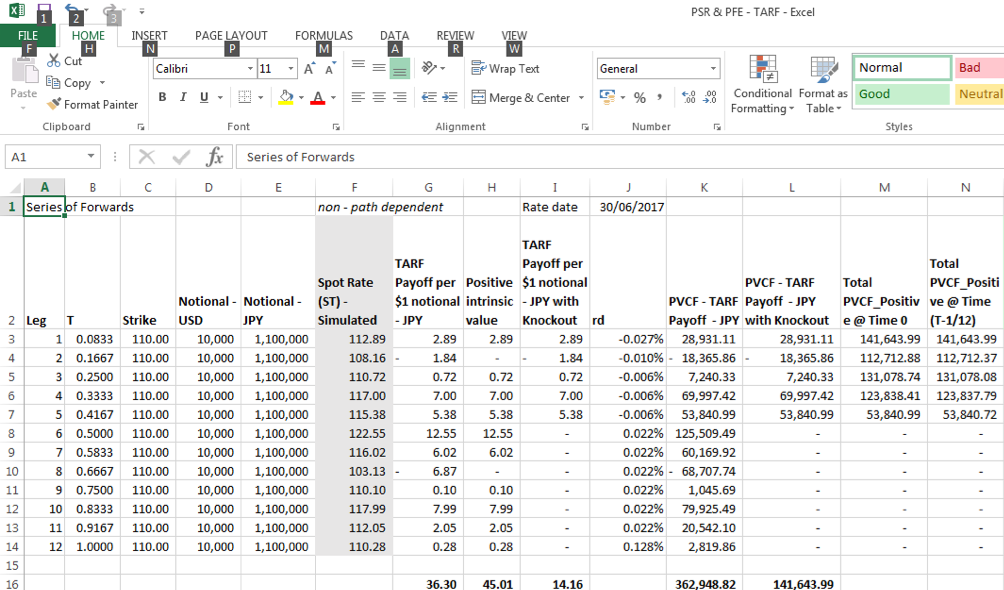
Column L gives the payoff for each leg of the TARF, subject to the knock out feature and discounted to Time 0.
For each leg, Column M shows the sum of the values determined in column L for that leg and all subsequent legs, provided that the sum exceeds zero.
Column N calculates the total value as at the beginning of the given leg.
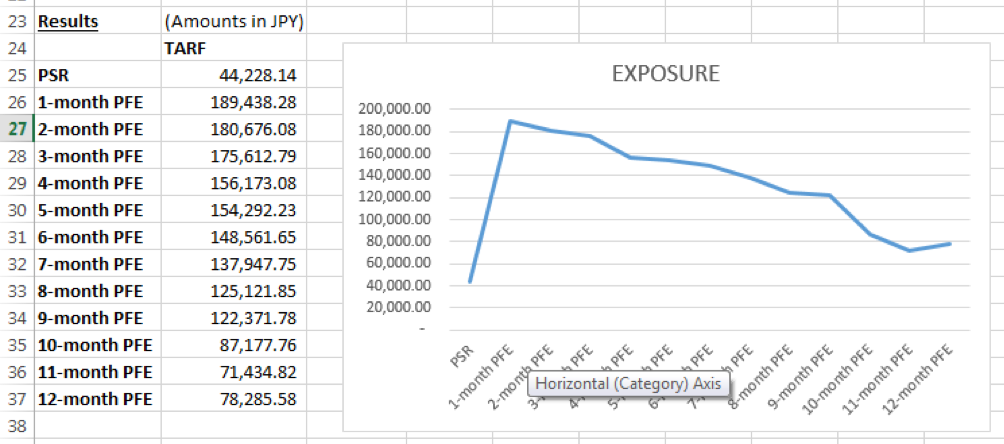
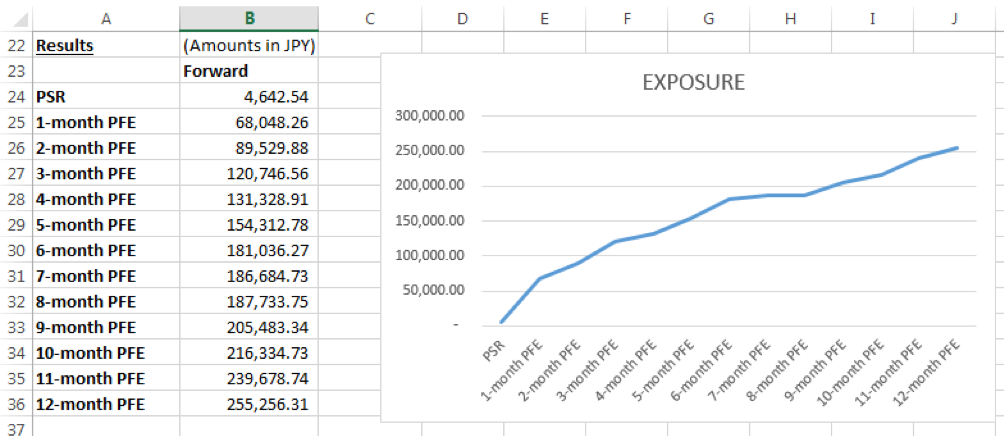
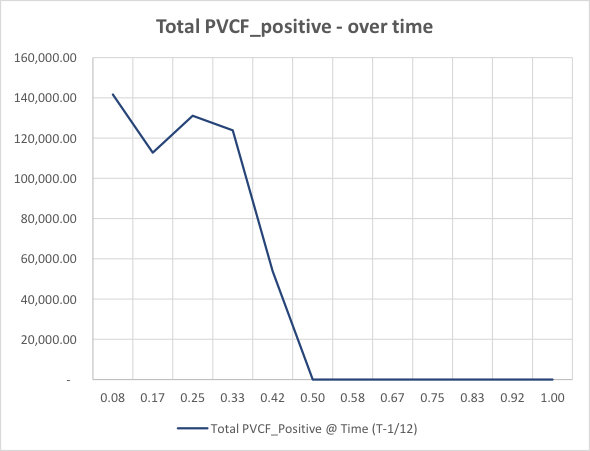
For one simulation run the PFE for each future period is plotted below:
1000 simulations are run and the results for PFE at each future date are captured in the data table. Expected Exposures, PFEs and MPFEs are then calculated:
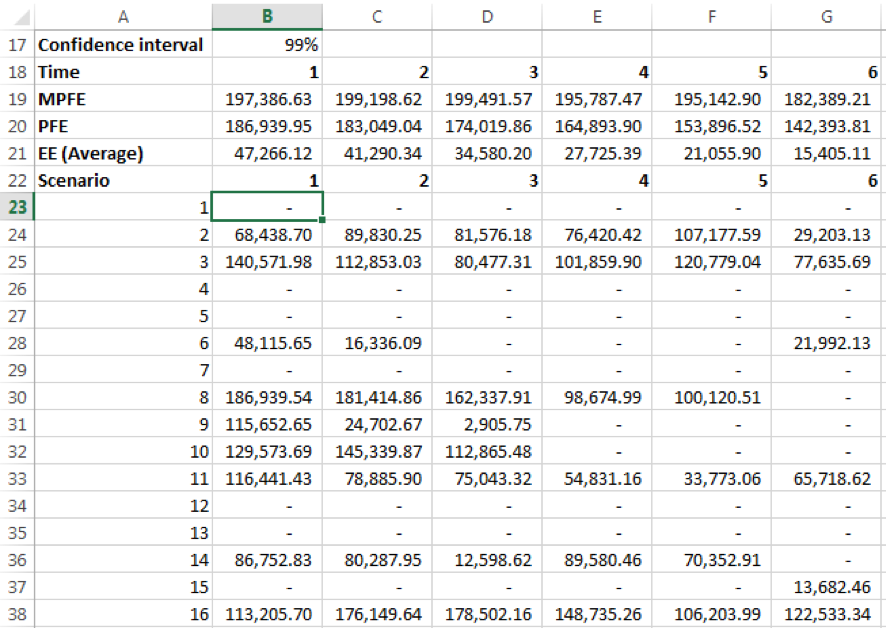
The summary of results for the TARF transaction are given below: