Pre-settlement Risk (PSR) & Potential Future Exposure (PFE) calculates the counterparty credit risk for derivative transactions. PSR calculates counterparty default risk at a static point in time whereas PFEs assess the risk over the transaction’s lifetime. We use the measures to set counterparty and credit limits in order to mitigate against these risks. In this series of posts, we look at the PSR PFE calculation for FX derivatives including a TARF.
Pre-settlement risk (PSR) is the risk that a counterparty to a transaction does not honor his/her end of the deal and defaults on the transaction prior to the settlement date. The other party to the transaction will need to cover the position in the open market most likely at adverse prices/rates.
Potential Future Exposure (PFE) is the maximum expected credit exposure over a specified period of time calculated at some level of confidence (i.e. at a given quantile).
We will look at the PSR PFE calculation for the following transactions:
- A call option on USD (put option on Yen),
- A long forward contract to buy USD at a given strike at a pre-specified time in the future in exchange for yen, and
- A target redemption forward (TARF), i.e. a series of forward contracts that terminate when the cumulative positive intrinsic value reaches a specified target value.
Call Option – Pre-settlement risk (PSR)
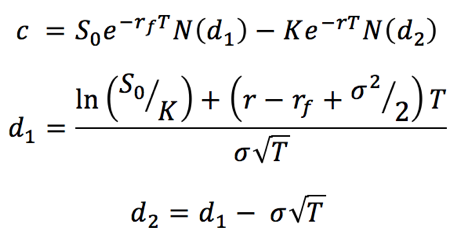
We are looking at a one year European call option on the USD dollar. The buyer has the right to exercise the option to buy USD 10,000 at the strike rate of USDJPY = 110. The current spot rate (S0) is 111.21 and annualized volatility (σ) is 7.88%. The JPY risk free rate (rd) is 0.128% and USD risk free rate (rf) = 1.732%. The option’s start date (and the current calculation date) is 30-06-2017.
The buyer will exercise the right to buy USD, if and only if, the spot exchange rate exceeds the strike rate at maturity. That is, if the USD appreciates against the yen or alternatively JPY depreciates against the dollar relative to the strike rate.
PSR will be the highest for the option buyer when the derivative is in the money and conversely out of the money for the counterparty. If the counterparty fails to meet his obligation and defaults on the transaction, the buyer of the option will either need to replace the derivative as soon as possible or cover the long USD position in the open market at expiry. Given that the USD has depreciated against JPY, he will need to pay more units of JPY to purchase a single unit of USD at expiry, as compared to the original strike exchange rate; or he must pay a higher premium to replace the option now.
Let us assume that the counterparty defaults immediately after we purchase the call option and remit the premium.
Replacement cost of the option
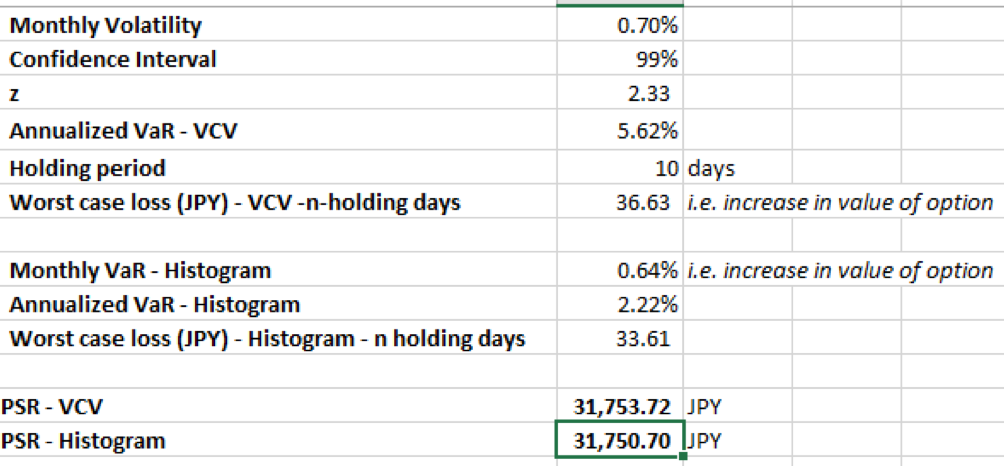
To calculate the pre-settlement risk of an immediate default, determine the current value of the position or the replacement cost at the time of default. In this instance, the current value of the position is simply the call premium.
However, the replacement cost may not always equal the current value of the position as of the default date, if there is a delay in covering the position. We may use a VaR based approach to determine the current replacement cost of the position to account for delays in re-covering the initial transaction. PSR, in this case, is the current value of the option plus the maximum increase in the value of the option that can be experienced over a specified period (say, the 10 holding days it could take to replace the option) at a given confidence level.
PSR calculation in EXCEL
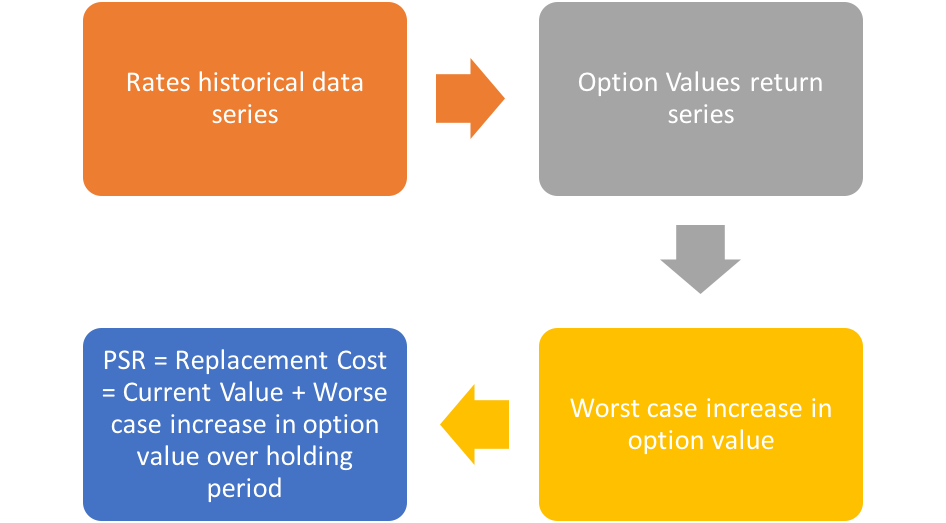
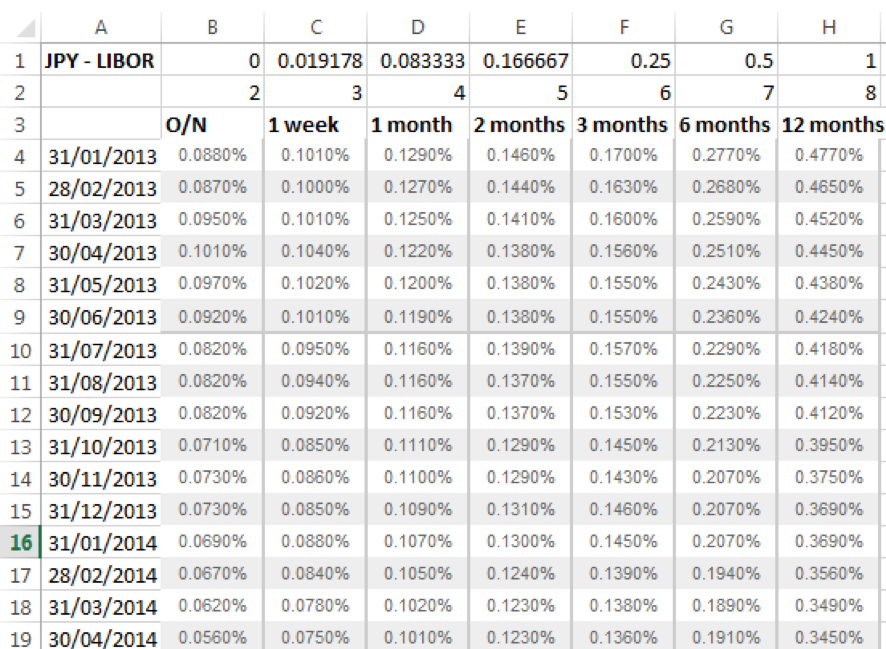
For the PSR calculation, start by capturing the historical series of risk free rates for the domestic (JPY) and foreign (USD) currencies. We have used the JPY LIBOR and the USD LIBOR as proxies for these rates. Obtain the monthly rates for the years 2013 – June 2017 from www.global-rates.com.
Assuming constant time to expiry, spot rate & annualized volatility, we calculate the value of the call option using the Black Scholes call option pricing formula for each rates data point, to obtain a monthly series of call option values.
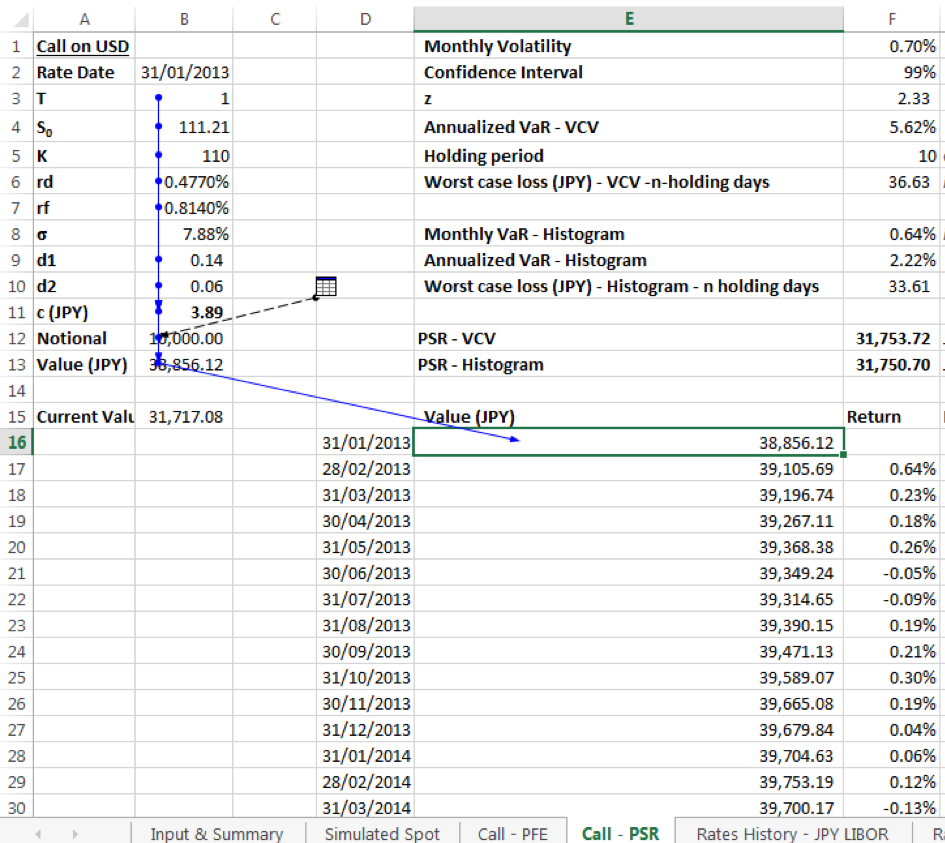
Then, generate a return series by taking the natural log of consecutive data point option values. The maximum of the return series gives the worst case monthly VaR% under the VaR histogram approach. The worst case VaR is an increase in the value of the option. Calculate the worst case increase over 10 holding days as:
Worst case monthly VaR % x Sqrt (12 x 10/365) x Current Value.
Alternatively, determine the worse case increase by using a Variance Covariance (VCV) approach:
- Calculate the monthly volatility of the option value returns, i.e. the standard deviation of the return series
- Calculate the z-value for a given confidence level, e.g. 99%
- Calculate the monthly VaR % = (1) x (2)
- Worst case increase over 10 holding days = (3) x Sqrt (12 x 10/365) x Current Value
The PSR for the call option is its Current Value plus the Worst case increase over 10 holding days.
Call Option – Potential Future Exposure
To determine the maximum credit exposure over the tenor of the call option we need to first create a Monte Carlo simulation model for the spot exchange rate.
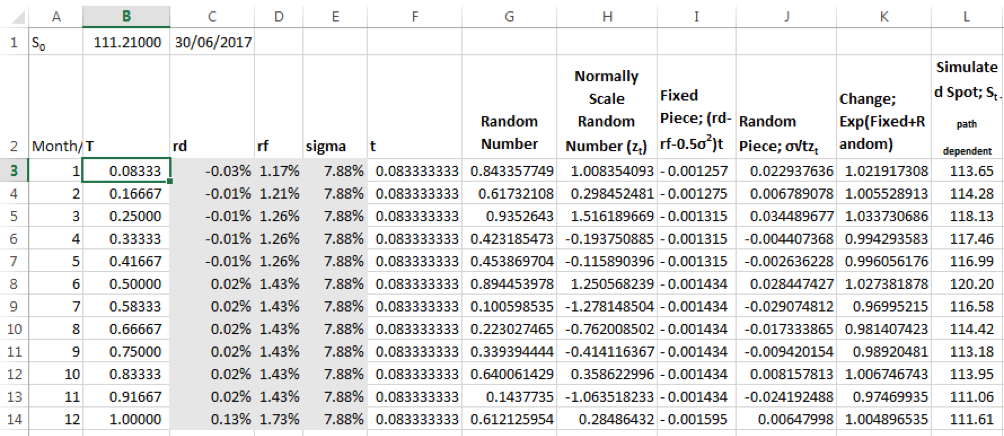
To simulate monthly spot rates for the year we use a twelve step model. Assumption: The risk free rates term structure and implied volatility remain unchanged from what they were on the current valuation date.
We next calculate the value of the option using the Black Scholes formula with the corresponding simulated spot. Determine this for the current valuation date and on each subsequent month end:
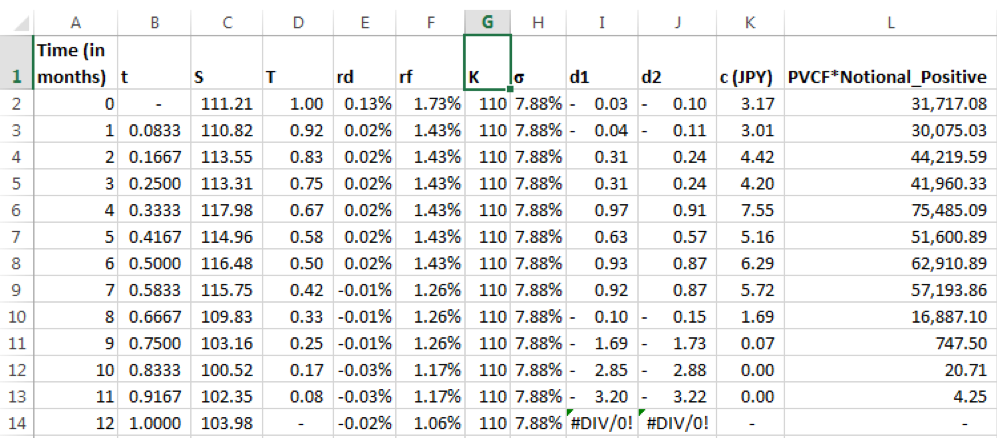
‘t’ is the time elapsed, while ‘T’ represents the time till maturity, i.e. Tenor of option – time elapsed.
For this particular simulation run, the plot below is of future option values across times till maturity:
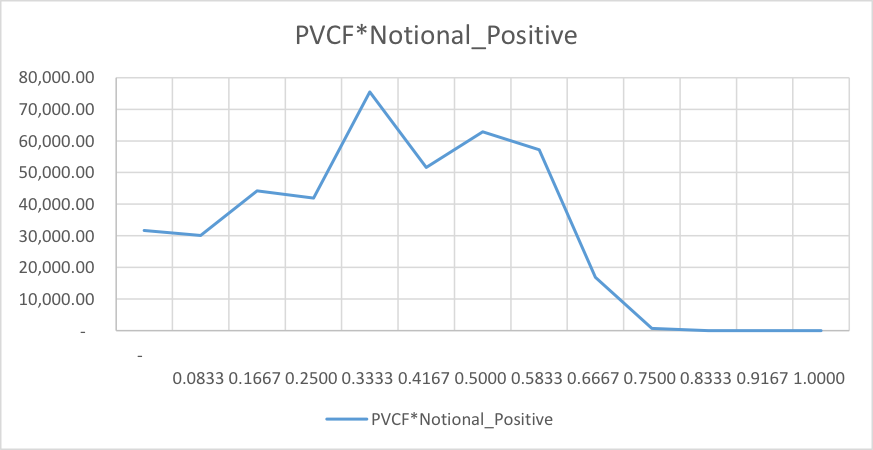
1000 simulations are run and the future options values for each time step are captured in a data warehouse.
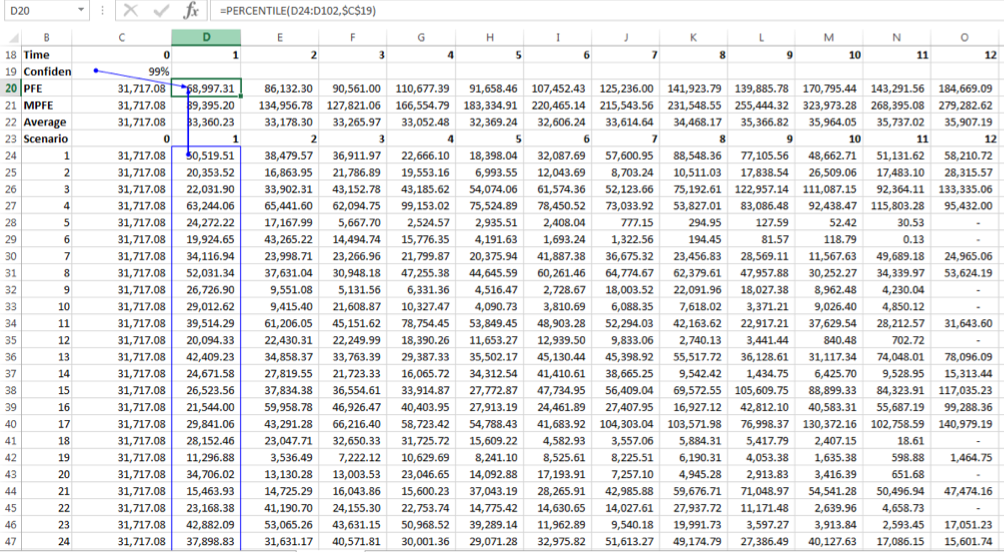
For a given future date, calculate the PFE as the upper first percentile (99% confidence interval) of the simulated values; MPFE is the maximum simulated value across all runs; Average is the average option value or expected exposure across all runs.
Summary of results
In summary, the PSR & PFE values for the call option are as follows:
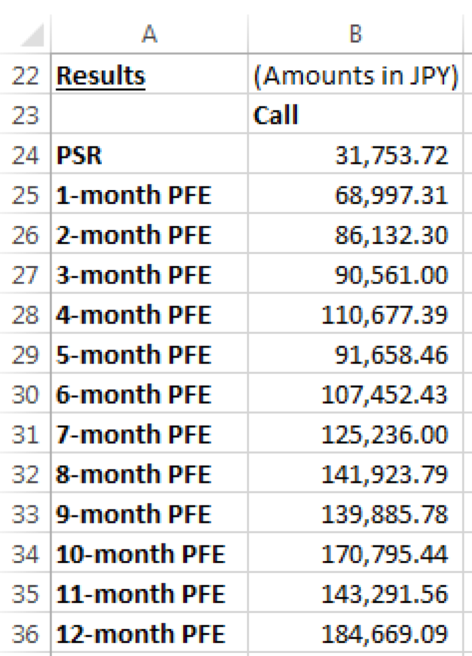
1-month PFE is the potential future exposure 1 month into the future. 9 months into the future the PFE stands at 139,885.78, and so on.
Stress test implied volatility
We assume that implied volatility increases by 3 times the existing levels. The multiplier applies to vol as a constant for the life time of the option. As a result, the PSR & PFE values also increase:
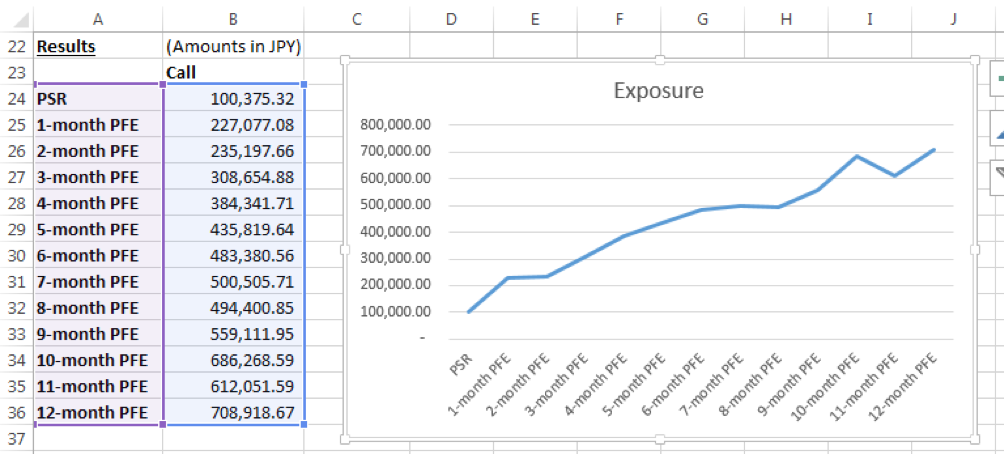
Note – The invariant nature of the interest rate term structure and implied volatility at future data points are not optimal. They should be reviewed and considered when refining the PFE model.
Our next post will carry out the PSR PFE calculations for a long forward and a TARF.
Also, See the TARF Pricing model guide to review TARF product features and behaviour as well as pricing approaches.
References:
- Credit Exposure on a Derivatives
- Introduction To Counterparty Risk
- A Quantization Approach to the Counterparty Credit Exposure Estimation
- Determination of Presettlement Risk in Different Instruments
- Trading and Capital-Markets Activities Manual