Value versus Growth
What is the difference between value and growth investing? How do the two investing models and frameworks differ from each other? Are there points where the two investing styles overlap or merg?
Value investing focuses on finding undervalued securities that are trading below fair market value. Growth investing focuses on finding securities where true growth potential is still ahead of them and is underestimated to some extent by the market. Both focus on generating significant capital appreciation when markets correct their view or valuations. Value companies tend to be players with established histories and presence that have taken a recent tumble or fall. Growth bets tend to be newer companies with strong historical earnings growth and even stronger projected forward growth. Growth is a bet on scale with improving profitability as sales volumes increase. Value tends to be a bet on recovery or turnarounds.
Value does it with a emphasis on margin of safety. Since the security in question is already trading at the bottom chances of decline are low given where the price trading with respect to breakup value. With growth if future projected growth rate is less than anticipated there is a chance that future price corrections may lead to capital loss.
Value Investing
Value investors look for opportunities where a security is trading at a steep discount to fair value benchmarks.
Markets react to news. Sometimes market reaction is balanced and based on collected wisdom. A promising potential star misses guidance for multiple quarters in a row. A new technology platform decimates older players. Commodity prices decline and the world begins to head towards a global recession. Corporate tax rates go down or up as part of a new initiative to kick start the economy or reduce the budget deficit. The central bank cuts the benchmark rates by half a percent. Over the years we have learnt to respond correctly to the right type of news.
Quite often though market reactions overshoot the bounds of reasonability. When markets panic, there is blood on the street because traders and investor want to conserve capital by cutting positions and losses as quickly as possible. This creates a pressure wave of selling that pushes prices down beyond what would typically be termed as fair value. By the time the wave is done there are many casualties. Some need the correction and are likely to stay down, rightly so. But there are always a handful who get caught in the cross fire and are waiting for their true value to be discovered.
Value investors specialize in identifying securities that are trading below fair value because of market over reactions. Not all market reactions create opportunities for capturing value. Some are death traps and falling knives that will not stop till the security in question hits pennies per share or gets delisted. Accounting scandals, regulatory fines for non-compliance with accepted norms, ethics violation, insider trading, security price manipulation, embezzlement, fraud, systemic abuse of authority and privilege are all signals that indicate significantly deeper problems. When price take a nose dive because of any of these reason, they tend to stay down. Everything else however is fair game.
There are three ratios that illustrate what value investors are interested in. Price to book, Price to sales and Price to cash.
All three are ratios that describe the relationship between the current price per share of an investment security (hence the term price) and the metric being measured on a per share basis. For instance within the banking industry if Citi is trading at a current price of US$80 per share and the book value per share is also US$ 80 then we say the Price to book ratio of Citi (Ticker: C) is 1. If General Electric (Ticker: GE) carries US$ 2 per share in cash and its share price is around US$ 16 the price to cash ratio is 8. The same concept applies to sales. Merck pharmaceutical (Ticker: MRK) trades at roughly 4 times sales. With a share price of US$ 60 per share this means MRK’s sales per share are roughly around $15 per share.
Just like Price to book, Price to sales measures the current stock price to sales per share and Price to cash measures the amount of cash per share to the price per share. Lower ratios provide a margin of safety that ensures that even if our bet was wrong and the timing was off, the security in question is not going to get any cheaper than it already is. Which is the central idea behind value investing. Terrific upside if you are right, limited downside if you are wrong.
How do these ratios help with value investing? If a business is trading at a discount, the ratios reflect that. For instance if GE had US$ 16 per share in cash and was trading at $16, the price to cash ratio would be 1. This would be mean that you could buy GE for just the amount of cash on its balance sheet and you would get everything else – the franchise, the business, the goodwill for free. However GE only has $1.5 in cash per share, is trading at 1.8 times book and 1.15 times sales (as at Friday 19th Jan 2018) – does that make GE a good value buy or a falling knife?
Let’s take a deeper look at Price to book. If we examined the banking sector and the assessment of some of the relatively bigger players in this space using these metrics over 2017 what would we see?

We see that Sumitomo and Citi, Prudential and Citizen Financials are all trading at low Price to book ratios compared to other banks in the list. This may be because of multiple reasons. Partly because of baggage from the 2008 financial crisis, expected write downs in the value of credit assets, changes in the outlook of the financial sector, anticipated regulatory action or more.
Still of the 24 banks these four become banks of special interest to a value investor given the discount at which they have been trading compared to peer banks. It is possible that additional investigation and analysis reveal that there is a reason for this discount and the banks in question are actually trading close to book value for a reason.
Citi specifically is an interesting subject. Recent performance of the bank has been promising, growing earnings for the 11 consecutive quarters as well as beating analyst expectations. There is also the value of Citi’s global franchise. The recent tax break and relatively easier to breathe regulatory environment in the US are all welcome breaks that the bank can use.
The question is are we getting a really good deal here on Citi essentially buying the business for what its worth at book value without paying for goodwill? Or there are still holes in the balance sheet not truly captured by the accounting book that the market has priced in through this discount. These are questions that a value investor would like to answer by taking a deep dive through financial disclosures and investigative analysis.
If you would like to learn more about value investing, there is no better teacher than Warren Buffet. Take a look at the Berkshire Hathaway’s complete collection of letters to the investors.
“It’s far better to buy a wonderful company at a fair price than a fair company at a wonderful price”. Warren Buffet [6]
Also see lessons for value investors from Michael Lewis’s book Big Short for an unconventional and non-traditional look at value investing.
Growth Investing
The growth school looks the investing question from a different angle. Like value growth investors are also interested in capital appreciation. However unlike value this appreciation doesn’t come from benefiting from market panics, over reactions or special situations or undervalued securities.
For growth investors the core idea is simple. Identify companies that have grown well in the past and still have a substantial growth spurt in front of them. Ideally at a rate that is unanticipated or unexpected by the market. The bet is on projected future improvements in both sales and profitability as the business scales.
The central idea is to identify candidates where markets are likely to under estimate the value of future growth or do not understand the true potential of the underlying business. As the business gets closer to its actual potential and markets revise prospects for future growth the security rises in value leading to capital appreciation. An illustrative example below shows how this would work in practice.
Imagine a brand new technology player that generates US$ 70 million in annual revenues and a million shares outstanding. Earnings per share stand at US$ 7 with a price to earnings multiple of 10 leading to a price per share of US$ 70.
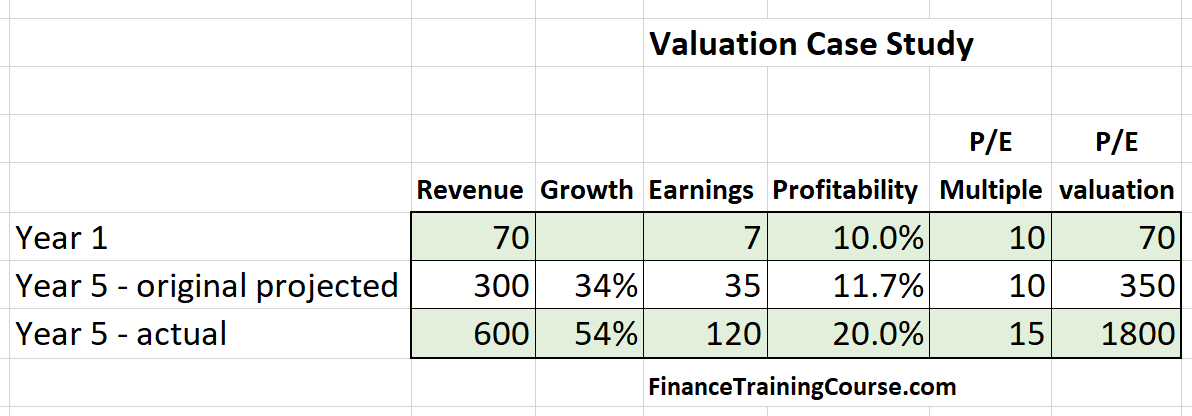
The market estimates that over the next 5 years the business in question will grow to US$ 300 million per annum, margins will also improve to about 12% and the business will still be valued at roughly the same multiple. So if we purchase the stock today at $70 per share, 5 years later we would be able to value the same shares at US$350 per share leading to a roughly 37% compounded return per year on our original investment.
In reality the security performs better than expected. Revenues and profitability both improve beyond expectations as shown above. Rather than 300 million we end up with 600 million in gross revenues. Compared to the projected 12% profitability we clock 20%.
The market responds in kind by increasing the Price to earnings multiple of the security because of significantly improved prospects for growth. The valuation jumps up from the anticipated 350 million enterprise value to 1.8 billion enterprise value.
Rather than booking a 5 times return in 5 years we end up with a 25 times return in 5 years – an annual compounded return of over 90%. The appreciation comes across in two levels. The first is the improvement in actual profitability per share – all the way from the projected $35 per share to $120 per share. The second comes from the improvement in valuation multiples. The market now values the business at 15 times earnings compared to the original 10.
The change in valuation and capital appreciation can be traced to three individual components.

- The first is the anticipated and projected growth in earnings per share from $7 to $35. This is the one that was priced in already.
- The second is the un-anticipated growth in earnings from $35 to $120. This wasn’t priced in and is the biggest contributor to capital appreciation.
- The third one is change in price to earnings multiple from 10 to 15. This was also un-anticipated.
You can clearly see, the big kick in capital appreciation and valuation comes from the un-anticipated changes in earnings and multiples.
Sounds like a fairy tale? I know. Take a look at the graph below of a well-known technology industry icon that followed a similar trajectory post their IPO in 1990. The numbers look familiar because the example above was inspired by their path.

Cisco (Ticker: CSCO) went from US$ 6 million in revenues to US$ 1.2 billion in revenues in 6 years. It followed this amazing feat by growing from US$ 1.2 billion in revenues to $18.9 billion in the next 6 years. The amazing part wasn’t just the growth in revenues in the first 6 years but the fact that they also improved operating profitability from 9% of gross in 1988 to 39% of gross in 1994.
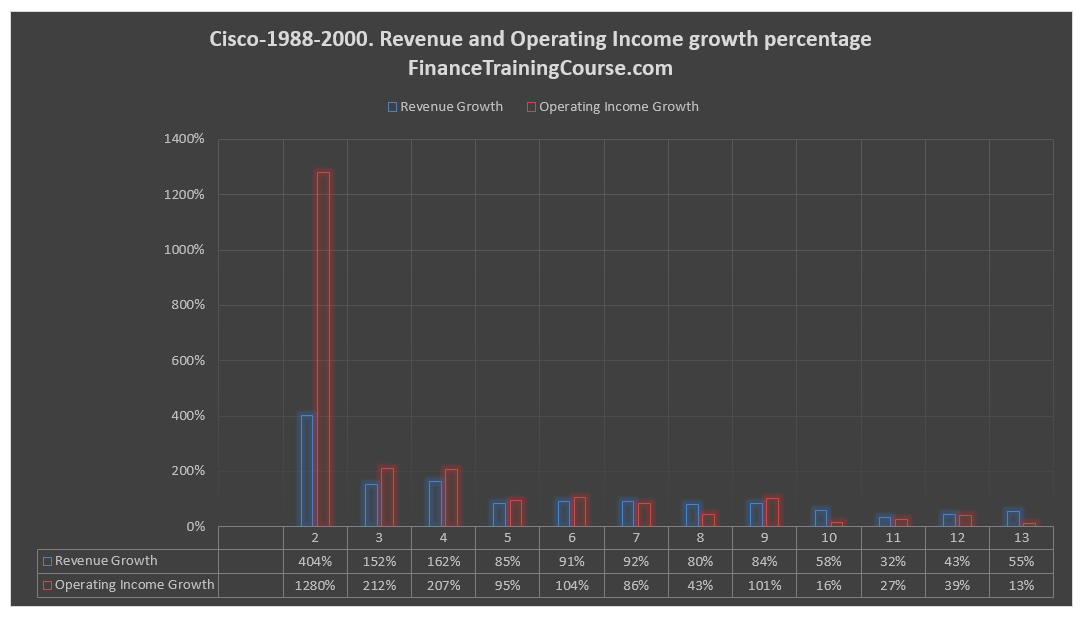
The market certainly anticipated some of this growth but it didn’t anticipate all of it. One would have thought that after the run up from the first six years, Cisco future growth prospects would have been all tapped out. Interestingly enough the CSCO growth story didn’t end in 1994 or 2000 or 2001.
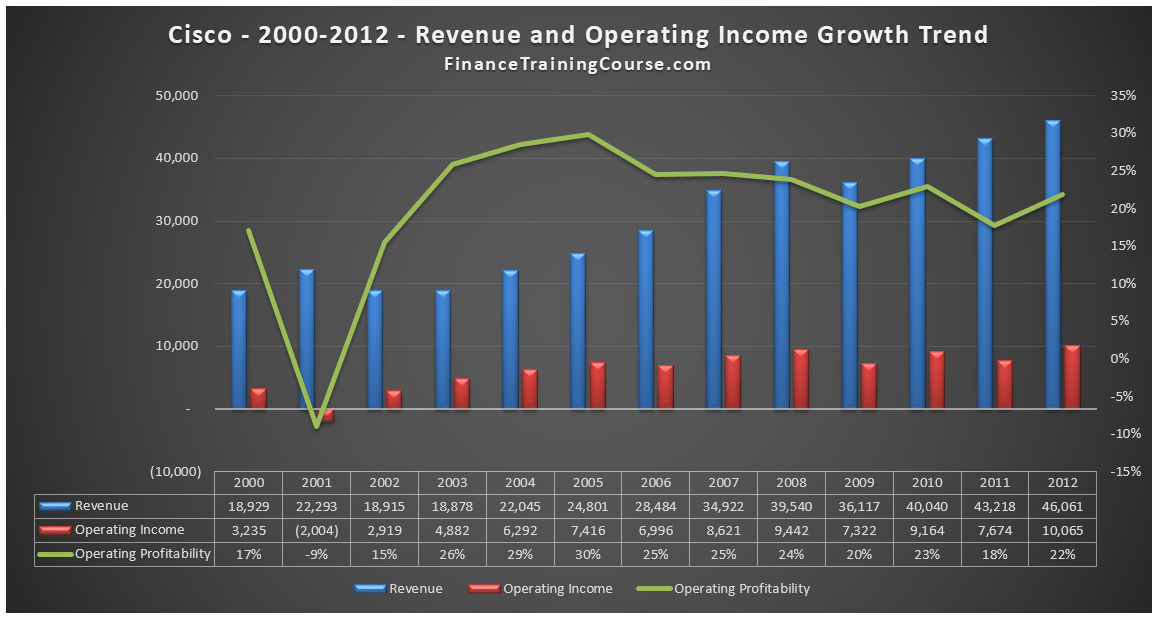
After taking a big hit with the correction in 2001 that followed the end of the dot com bubble CSCO took a few years to consolidate gains and the prior twelve years of consistent growth. It took off again in 2003 to book another 9 years of consistent growth in revenues and profitability. That is 21 out of 24 years of above average growth. Gravity finally caught up with CSCO in 2014 when year on year growth in revenue and profitability turned negative.
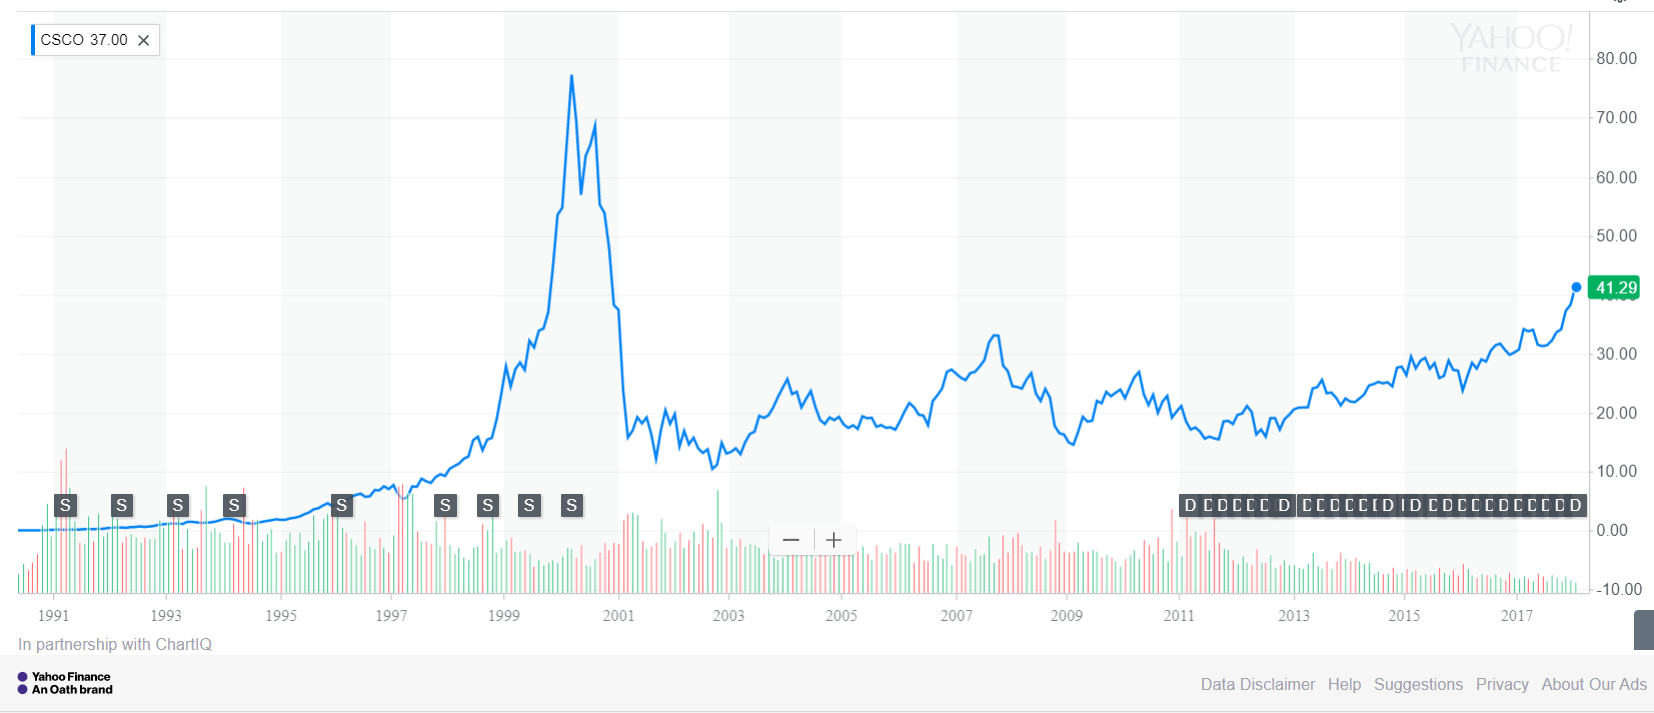
When you compare these facts with the CSCO price chart the un-anticipated growth part only held true from the 1997-2000 era. That is the point where CSCO surprised the market and you can see the sharp upside drive in prices. The internet drove it but it drove by driving sales and pushing future growth expectations to the point that at one CSCO became the most valuable company on the planet boasting a valuation in excess of US$ 500 billion. Post 2001, post the consolidation and recovery phase future growth was priced in and there weren’t any unanticipated surprises that would lead to the massive capital appreciation we saw at the turn of the century.
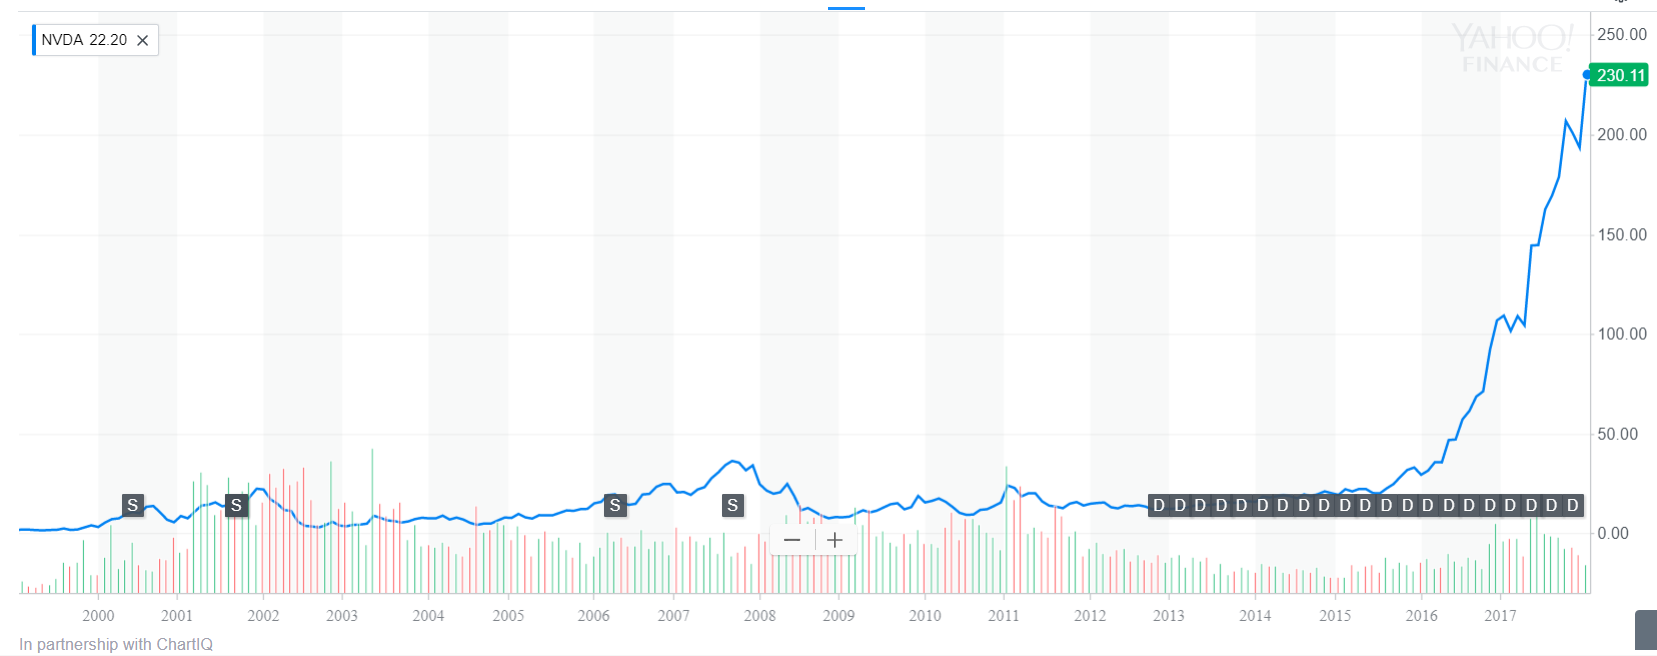
Compare CSCO graph with Nvidia Corporation (Ticker: NVDA) and you will see what we mean. NVDA has ridden the growth wave a few times before but the most recent rise beginning in 2014 is again an indication of growth unanticipated by the market or a growth story that the market just became aware of in 2014.