A case for falling crude oil prices
Crude oil prices have been falling steadily after reaching a four year high of $86.07 (Brent) in early October 2018. In this post, we look at six drivers to gauge the direction that crude oil price will be taking in the coming months of 2018-2019. These include:
- The ratio of global liquid fuel and crude oil production to global liquid fuel consumption ratio. A ratio greater than 1 indicates that there is an oversupply in the market.
- US Rig count and average production per rig. Increased rig count means that the US market is increasing production while an increase in average production per rig signals increased efficiency – more produced with the same resources.
- OPEC’s spare capacity. Diminishing spare capacity levels indicate that OPEC countries are producing closer to their optimal levels and hence adding to supply.
- US leading index data. A composite of economic indicators, this index is used as a measure of whether the US economy is either slowing down (declining index) or growing (rising index).
- EUR-USD exchange rate. In general, the relative value of the US dollar (strong or weak in relation to the EUR) has an inverse relation to crude oil price.
- Futures spread. A negative spread (i.e. spot price or prior delivery month future contract price is higher than later delivery month future contract price) indicates that the crude oil price is expected to rise in the short term as compared to the longer term.
What is the outlook for Crude Oil Spot prices? Based on an analysis of the data available from Baker Hughes, Federal Reserve Bank of St. Louis and EIA websites we believe that there is evidence that the crude oil spot prices will continue to fall despite recent supply cuts announced by Saudi Arabia for December 2018. The reasons for this premise are given below:
1. World production of crude oil & liquid fuels to World consumption of liquid fuels
The ratio of world production of crude oil & liquid fuels to world consumption of liquid fuels appears to be a valuable indicator of the direction in which Crude Oil spot prices will take in the future.

According to the graph above, prior to the second quarter of 2018, there were four points when the ratio value of 1 (production = consumption] was breached either as production increased or decreased in relation to consumption. In the quarters following each breach, there is a noticeable reversal in the direction of the crude oil spot prices.
By this logic, we have a bearish outlook for the price of crude and anticipate that a fall in prices in the coming quarters. While Saudi Arabia has announced December supply cuts there is concern about increased production continuing from the other major exporters, US & Russia.
Is this fall in price merely a correction of the early spot price peak triggered by supply shortage fears due to Iranian sanction and subsequent supply cut news or does additional data support a continued fall in crude oil prices?
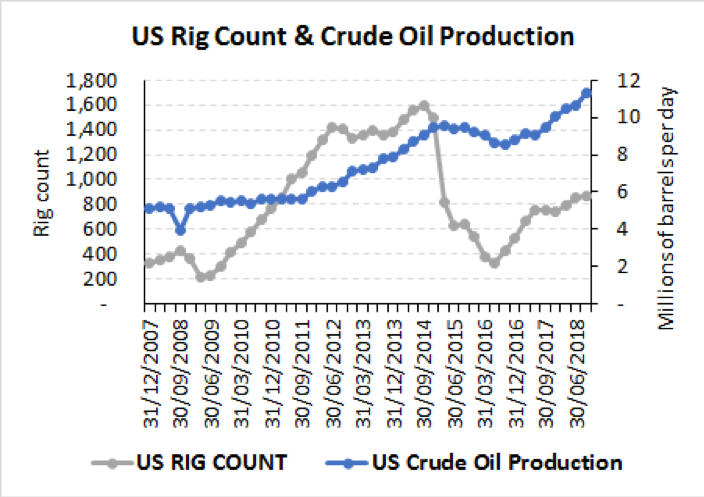
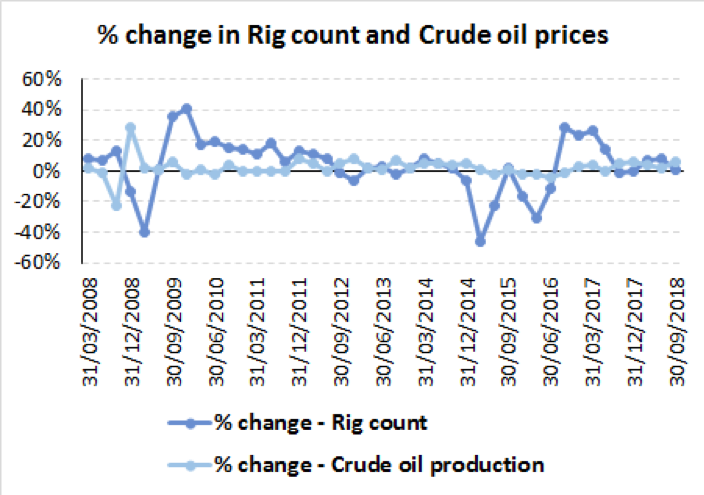
2. Rig count & Oil production
In our earlier post, we had surmised that per rig productivity would increase over time as more efficient rigs would survive and marginally profitable ones would be shut down. Hence declining rig count does not necessarily imply reduced production or increase price. This is evident from 2016 data, when rig count fell by more than the fall in productivity. Since then there has been an uptick in active rigs, notably though not to the levels of 2011-2014, and productivity continues to steadily rise.
Average productivity per rig is given below:
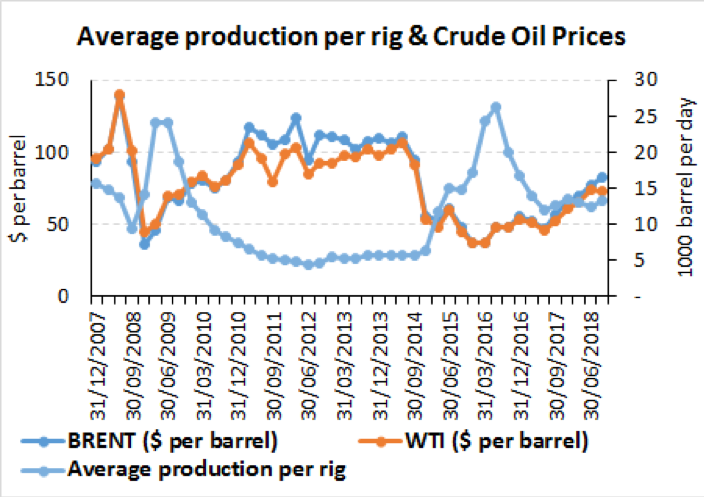
There appears to be a negative correlative between crude oil prices and average production per rig. For a given level of consumption, as rig production improves we would, therefore, expect to see a decline in crude oil prices as supplies increase. Rig count has increased to 886 in the week ending November 9, 2018 and total productivity has increased to 11.6 million barrels per day and is expected to rise to 12 million barrels per day next year. From a global supply perspective, not taking into account the differences between the crude oil produced, the 0.5 million barrels per day expected December cut announced by Saudi Arabia would be dampened by this increase.
3. OPEC Spare capacity
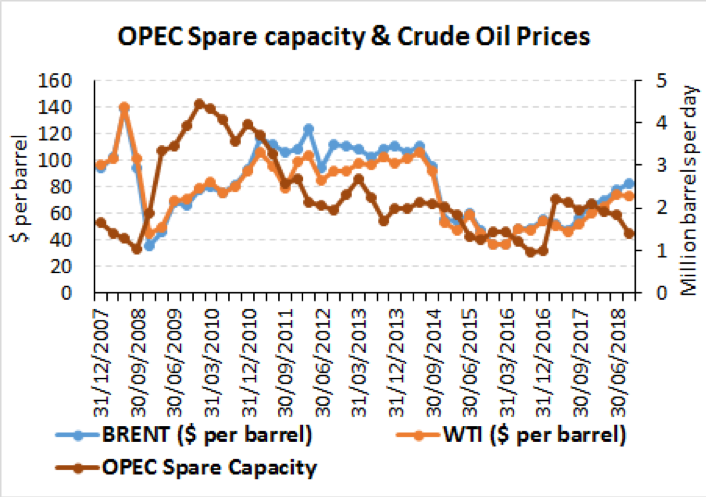
Spare capacity for OPEC has been on the decline since Q2 of 2017. This means that OPEC countries have continued to add to crude oil supplies. Decreasing spare capacity adds downward pressure on crude oil prices. OPEC countries and other crude oil exporters are considering output cuts extending into 2019 to address the glut of crude in the market accompanies by its weakening demand. However conflicting statements from Russia regarding the existence of oversupply and their motivation to cut production, adds a degree of uncertainty to OPEC’s impending decision.
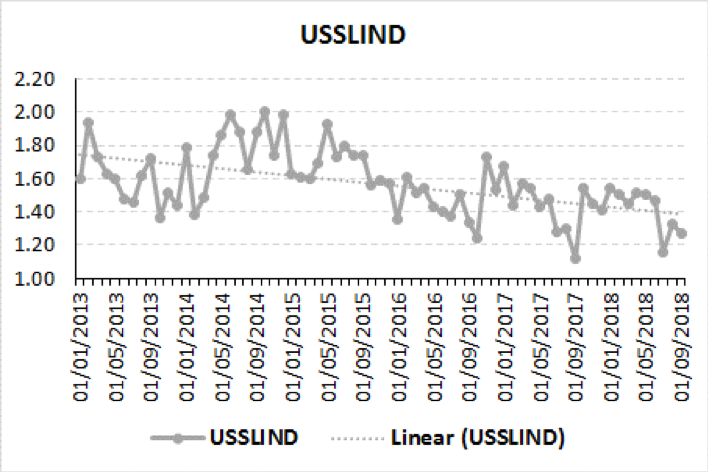
4. Leading index for the US
The leading index published monthly by the Federal Reserve is a composite of many economic indicators and is used by economists and analysts to predict how the economy is going to behave in the future.
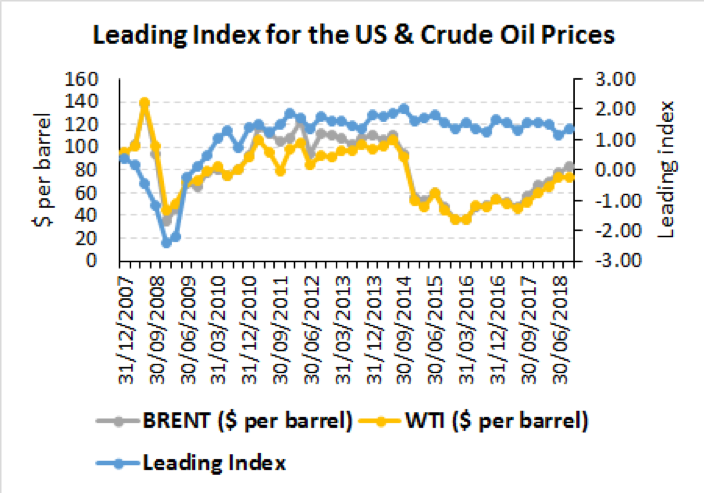
A declining index (as can be seen from the trend line Linear (USSLIND) plotted along with the leading index in the graph below) would be an indicator that the economy is slowing down leading to suppressed demand for crude oil and related products. Falling consumption relative to production could lead to a fall in crude oil prices. This contributes to our bearish outlook for crude oil prices.
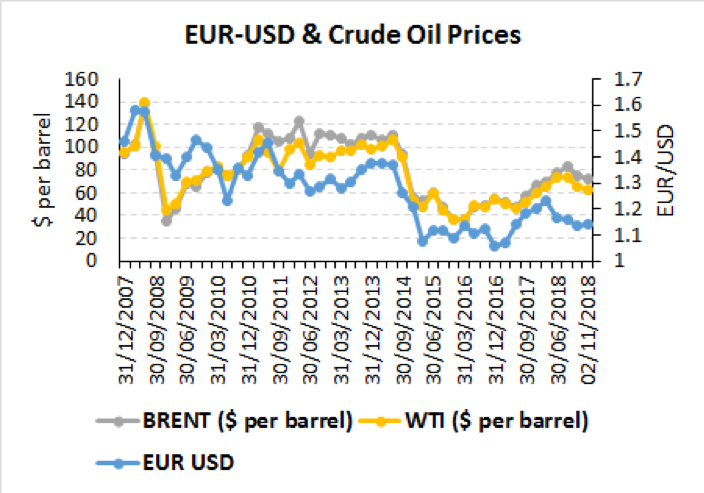
5. EUR USD exchange rate
The dollar has strengthened against the Euro. In general, as the US dollar currency strengthens the price of crude oil (denominated in US dollars per barrel) will fall.
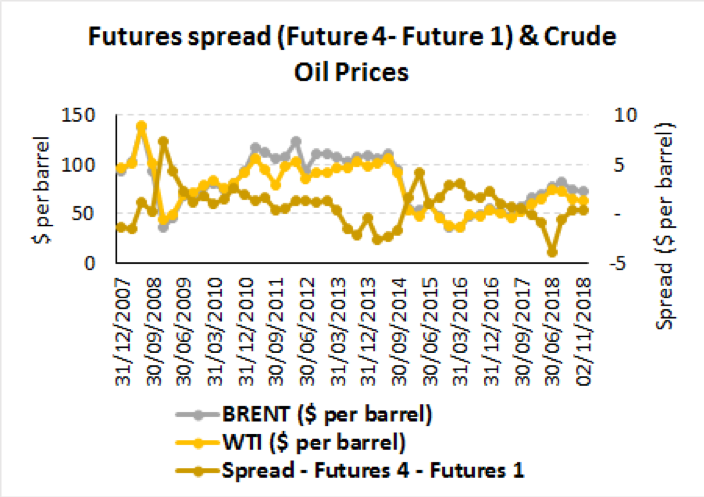
6. Price of future contracts
The positive or negative spreads between the future contracts of successive delivery months inform of the markets current & future sentiments regarding crude oil. A negative spread over a prior delivery month’s future contract price indicates that the market expects the price of the crude to rise in the short term as compared to the longer term. In early October 2018, the negative spreads peaked indicating a rising spot price outlook driven by fears of pending US sanctions against Iran crude oil exports. However, since then, primarily as a result of the waiver of sanctions granted by the US to 8 countries to continue their crude oil imports from Iran for the next 180 days, sentiments have changed. Spreads of later delivery months’ future contracts price over those of earlier delivery months as well as over the spot price have now turned positive. The current contango market, where spot prices are less than prices on futures contracts, implies a concern in the market of short term oversupply of crude.
In this post, we have looked at the drivers for crude oil price to see whether the current fall in prices is expected to continue for the remaining months of 2018 & into 2019. In particular, we have looked at the relationship of crude price to global crude oil production and consumption levels, US rig count & average rig productivity, OPEC’s spare capacity, US leading index, EUR-USD exchange rate and crude oil futures contract prices spread.