Forecasting prices for commodities and financials securities has always been a challenge. For securities one begins with a review of corporate profits, outlook on future growth and interest rates, stage of business cycle, interplay between segments, economic indicators, consumer demand and confidence. We use all these drivers to build a broad model. We then extend the model and narrow the lens on a given scrip or security or commodity.
Despite sophistication of above analysis and resources thrown at it, analyst predictions and price targets fall short. Analysts may get projected earnings right on a quarter to quarter basis but often miss big moves in sectors they follow.
Modeling oil prices becomes an even bigger challenge.
To begin with energy is complicated. One, economic growth is directly linked to energy consumption and consumption trends are changing ever year. With economic growth demand is likely to grow but what will feed that new demand is open to question. The fuel mix that produces energy for the world is in transition because the underlying mathematics is shifting.
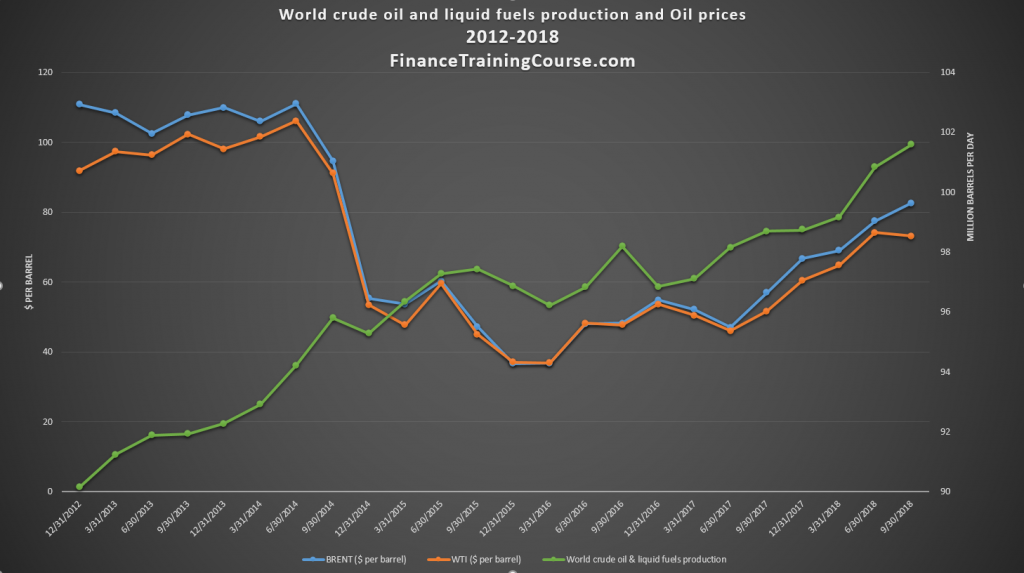
Figure 2. Global Liquid fuel production and prices 2012-2018. What does the future hold?
Two, the dissecting lens needs to be broader. It’s not enough to look at one economy. We need to look at about a dozen. The top 7 producers and their incentives. The top 5 consumers and their economic outlook. As economists we expect China to double up its GDP one more time and India to do the same but over what time frame? A decade and a half? Or two or five? What about Africa? How we answer these questions shapes our analysis.
We need to look at the competitive dynamics between the 7 large producers and their ability to act together as a group when it comes to setting prices. For instance, OPEC+ refers to the Organization of Petroleum Exporting Countries (OPEC) and Russia. In 2018 this group controlled 44.5 million barrels per day of crude oil production representing between 46%[1] of global oil production. To simplify our analysis, we refer to OPEC as one entity but it is a consortium of 15 member countries. OPEC+ makes it 16. 16 members that don’t necessarily see eye to eye, like or trust each other but are bound by a structure put together 50 years ago by a different generation.
Questions?
Then there are questions, a great deal of them. Some more interesting than others.
For instance, will electrical vehicles, autonomous driving, hybrid cars dramatically change energy demand and global fuel bills? Is there some version of future where our good old internal combustion engine goes extinct? Why does it take so long for lower oil prices to reflect at fuel pumps and gas stations? Who really controls oil prices and why do they jump around so much? Are we going to run out of fossil fuels anytime soon? Should I be worried? Why worry about oil running out when we still have 70 years of liquid fuels and 52 years of natural gas[2] in the ground? Who consumes what? Who are the largest consumers and why is their consumption pattern changing? What is shale and why is it such a big deal? Why isn’t nuclear power generation growing? What about fusion?
In my quest to understand oil prices, I found answers to some of the questions. Others were nested loops, puzzles within puzzles.
Model Complexities.
There is no such thing as one flavor of crude oil or one price for the commodity. There are a variety of blends. A blend is defined by its API gravity (a measure of whether liquid in question is lighter than water or not) and its sulfur content. Blends with higher API gravity are lighter, with lower are heavier. Blends with lower sulfur content are sweeter, with higher sulfur content are sour. Hence the terms light sweet crude versus heavier sour crude.
West Texas Intermediate or WTI is a light sweet blend and serves as the North American pricing benchmark. As the name suggests it is blended primarily from crude oil pumped across multiple fields in the US. The Arabian and Iranian heavy are both heavy sour blend. Brent the pricing benchmark for the non-American world is a light sweet blend that is pumped from North Sea fields.
While daily consumption and production of crude oil hovered around 100 million barrels per day in 2018, trading volume on financial future contracts (essentially paper oil) averaged between 600-700 million barrels per day on Chicago Board of Option Exchange /CME (CBOE) in last two months of the year (Nov, Dec 2018). That is just trading volume on the front month or CL1 contracts on WTI which is just one contract on one crude oil blend out of many listed on the exchange. Volumes on following months are lower but still significant. There are similar contracts that trade Brent on the Intercontinental exchange (ICE) in London.
Future contracts give buyers and sellers a way of buying and selling crude oil on dates in future on a price agreed upon today. Contracts trade on an exchange that guarantees settlement and removes the counterparty credit risk from such transactions. They give buyers and sellers a tool to manage uncertainty around prices in the future. By locking down prices today, consumers and producers can both manage to stay within their original budgets.
The paper contract in question is the NYMEX West Texas Intermediate (WTI) Light Sweet Crude Oil Future contract linked to the primary US blend (WTI) due for delivery in the next month (hence the term front month). In December, the front month is January, in January it becomes February.
Note that this (futures market) is a different market from actual physical trading of crude oil. For instance, when Indian, Chinese or Thai refineries buy a crude oil cargo from Saudi Aramco, ADNOC in Abu Dhabi or INOC in Iran, they don’t buy it through the NYMEX contract. They buy it directly from the producing entity or intermediate petrochemical brokers. All three countries sell a range of blends that don’t trade on paper at any exchange. This is the physical market.
While the two trades – paper versus physical – are in different markets the markets are not isolated. They are connected. The NYMEX WTI contract is a deliverable future contract linked to physical delivery of a specified number of barrels of WTI blend[3] if we hold our position to maturity. We normally don’t but we can. This creates the link between paper and physical market.
Price pressures on WTI in financial future markets translate into physical market and vice versa. Producers in Middle East quote prices in terms of primary pricing benchmark plus a premium or discount. What happens to WTI and Brent sets the price for rest of the world.
Global production and consumption is not that volatile. It moves within a range of 1% to 2% a year. Volatility on future contracts on oil is a function of leverage, positions and views. It changes more frequently and with a bigger swing.
While the flexibility and market completeness provided by financial future contracts is a big plus, trading on paper markets creates an additional source of price influence on underlying physical commodity. Not all volume we see on futures market is linked to physical trade, some is linked to hedging, some to trading and the rest is essentially a directional bet on crude oil prices.
Let’s try and digest the above.
The world produces 100 million barrels of oil a day. It consumes just as much. Yet trading volumes on the largest futures exchange average 1.4 million contracts per day. Each contract represents 10,00 barrels. Which adds up to a traded volume of 1.4 billion barrels per day. Essentially 14 days of global consumption spread over 6 months.
This is not backed by physical production. NYMEX Lights Sweet Crude Oil contract (NYMEX WTI) acceptable blends total regional production is less than 10 million barrels per day. We trade 140 times physical production on average per day.
Trading on “paper market” is also a lot more volatile
than 1% or 2% change we see in demand or production on year on year basis. This
is the primary source of volatility in oil prices that we see every day. Is
this good or bad? Ultimately in the
long run efficient markets lead to better pricing for consumers. A part of that
14 days of consumption is intermediary players (petrochemical brokers and
traders) using financial markets to get better, more stable long term prices. Increased volatility is the price we pay to
get that benefit. That is a market friendly view that works for most people. There
are alternate views that are on the other extreme.
Data sources.
Where should one start when the objective is to understand oil?
The Energy Information Administration (EIA). EIA is a US government entity which produces both short term energy outlook and annual energy outlook. Primary focus is US demand and consumption trends. The second source is OPEC. OPEC does a monthly update summarizing production and consumption trends across OPEC and non-OPEC members. The third source is the Dallas Fed energy survey. Updated on a quarterly basis Dallas Fed energy charts capture oil producer sentiment in the US and includes equally useful information about shale producer breakeven points, capital investment and market outlook. The fourth is the annual energy outlook produced by British Petroleum (BP). The EIA Annual outlook projects demand to 2050. BP’s energy outlook goes to 2040. The OPEC monthly summary provides a projection for the next year with monthly updates. Dallas Fed also does a short term outlook, one year forward for consumption, demand and prices for both crude oil and natural gas and a quarterly update to its energy charts.
Beyond these four sources if you need additional data elements and data sets you can look at the Federal Reserve Bank of St. Louis as well as Quandl.
What information are we looking at when we parse these sources?
The simplest, most important and predictive driver of oil price outlook is the difference between supply and demand. Production and consumption of liquid fuel products. Prices are likely to move if gap between these two drivers widens significantly. Prices move up if consumption consistently outstrips demands. Prices move down if production leaves consumption behind.
The second data element on our list is spare crude oil production capacity. This represents capacity that be brought online by leading producers when market conditions demand it. It serves as a buffer against demand side shocks and a cap on price increases when excess supply is available. National oil producers in Saudi Arabia, Iraq, Iran, Kuwait, Libya and other countries evaluate production not just in terms of peaks and lows but also in terms of strategy. Is it better to pump at low prices or leave oil in the ground? Saudi Arabia used to be the marginal producer given that nation’s ability to bring production online or take it off stream. Recently US shale oil producers have helped take US production to 11.9 million [1]barrels of production, doubling production levels hit in 2009.
For both projection and consumption, it is important to have a sense of history and future direction. Where have we been and where are we heading? We are also interested in commodities and fuel sources that are near substitutes. For instance, in North America natural gas availability and low prices have made it the fuel of choice for power generation.
The fourth driver is volumes on future contracts and the spread (difference in prices) between different future settlement months. The front month is the immediately next month and is CL1 contract. We tract the price differential between CL1 and CL2 and CL1 and CL4. For us the contract of interest is the front month contract CL1.
In terms of data we are interested in difference between prices of CL1 and CL4 and traded volume for both contracts. Ideally we would be interested in trading volumes leading into, during and after a crisis. The spread between the contract is a proxy for markets view of where prices are heading 2-3 months down the road.
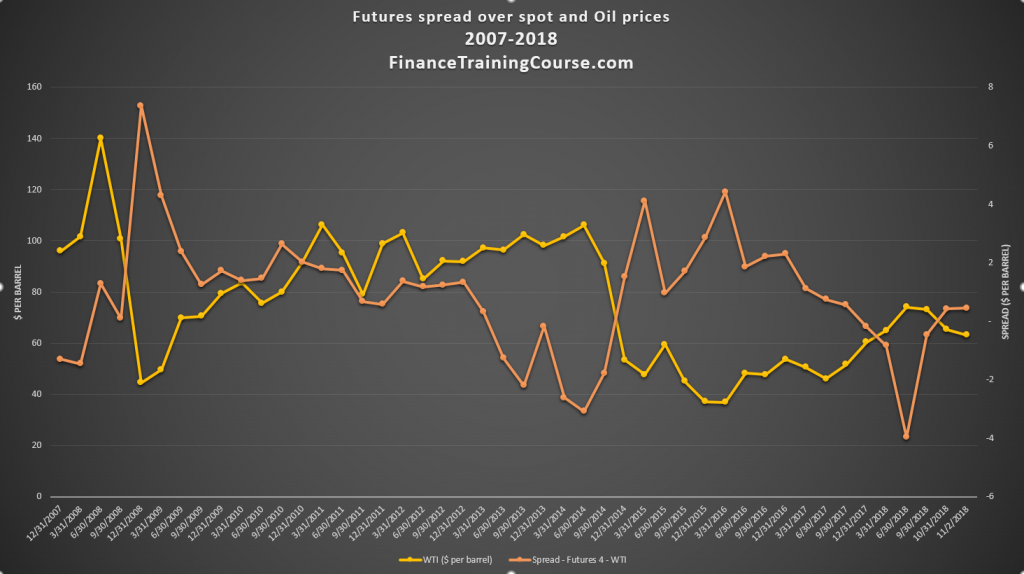
Figure 3. The spread between front month (CL1) and fourth month (CL4) future contracts on WTI. When spreads turn negative prices are likely to fall in future months.
Thesis.
What are we evaluating?
The first thesis. Decline. Oil prices will fall under a certain set of conditions. When there is a supply glut in markets and there is not enough demand. Evaluating this thesis should be easy. We have an idea of projected crude oil supply (production) for 2019. We also have a sense for global growth in crude oil demand for next 12 months. Comparing the two outlooks can answer the question, will we have too much oil or just enough.
The alternate thesis. Rise. Oil prices will
rise under an opposite set of conditions. A shortage of crude oil and not
enough supply when compared to consumption and demand. Evaluating this thesis
should also be easy because it is the same model again. Compare projected
supply with projected demand and get a sense for where we will stand in
2019.
Sounds deceptively
simple. It isn’t.
[1] Source, EIA, Short term Energy outlook, January 2019.
[1] OPEC December 2018 monthly review
[2] BP statistical review of world energy, June 2018, 67th edition. All figures year end 2017. 1.7 trillion barrels of proven reserves with a Reserves to production ratio of 70 years. Essentially 70 years of liquid fuels left in the ground. Natural Gas proven reserves 194 trillion cubic meters with a Reserves to production ratio of 52 years.
[3] NYMEX Crude Light Sweet Oil contract is known as NYMEX WTI but accepts a range of blends which are not necessarily WTI. Acceptable blends include WTI Midland, domestic sweet and other light sweet crude versions that meet the required contract specifications for delivery.