Demand drivers of a crude oil pricing model
The best way to model demand is to take a look at how we consume energy today at a national or global level and then extend that model to 2019 and onwards. The question we want to answer is, what segments are biggest consumers of energy and what fuel mix do they use to generate that energy? Who consumes what? How is that going to change in future?
If you are looking for a short and sweet answer, economic growth is linked to energy. As long as there is growth there will be demand for more energy. To predict how much and over what time frame we needed a deeper dive.
While the US doesn’t serve as an ideal model given its many difference with the world, it is the single largest energy market and EIA does generate a great deal of useful public data. We can use that as a base case with the assumption that China, Europe and other consumers will follow suit in similar directions.
The 2018 AEO report published by EIA shares two useful graphs that project trends for the next 32 years. The graphs provide two useful data point. Energy consumption and the fuel mix used to generate energy. The largest consumers of energy at a national level in the US as per 2018 outlook were
- Generation of electrical power
- Transportation
- Industrial customers
- Residential customers
- Commercial customers
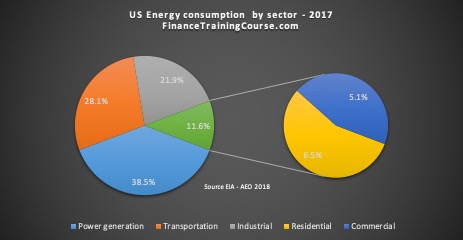
Figure 4. US Energy consumption by sectors. Source EIA
These consumers and their demand for energy was fueled by
- Petroleum and other liquids
- Natural gas
- Coal
- Nuclear
- Renewables
- Hydro
- Other biofuels
The graph below shows the US energy fuel mix as it stood at the end of 2017 and as it’s expected to stand by 2025 according to EIA projections.
In 2017 petroleum products and liquid fuels represented only 1% of the fuel mix used by the electric power generation industry in the US. Petroleum products were used essentially by transportation, industrial, residential and commercial customers. By 2025 the energy share of liquid fuels is likely to fall even further as Natural Gas and Renewables increase their share of total energy consumption.
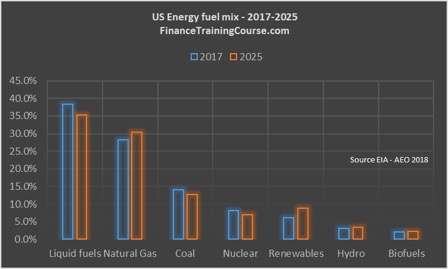
Figure 5. Projected US Energy consumption and the sources that feed it. The mix shifts between 2018-2025
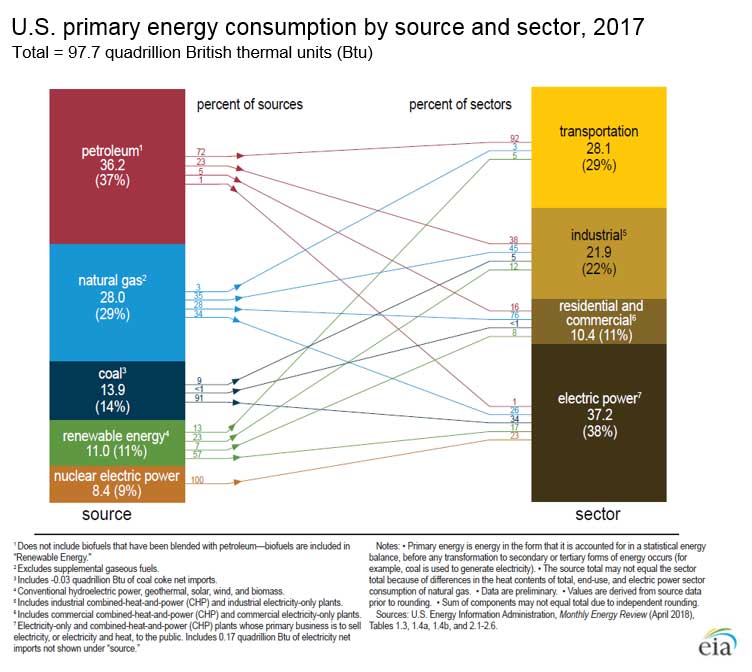
US shift is driven by abundant availability and depressed prices for natural gas as well as tax credits for renewable projects. The energy flow diagram for US economy (credit: EIA) is a perfect canvas for understanding how energy consumption is likely to evolve as other economies move up on development and prosperity scales. China, the second largest energy market is also likely to follow a similar strategy as it battles to reduce emissions and improve air quality. Europe not as fortunate as US and China when it comes to natural gas, is also likely to use a mix of coal, nuclear and renewables rather than fuel oil for power generation.
Overall global energy demand is likely to grow over coming years but fuel mix generating that energy is likely to have less crude oil than in prior years.
If growth in global energy mix doesn’t come from power generation, the next two big candidates are transportation and industrial consumers. A large percentage of demand models have pinned their hopes on transportation. As India, China and Africa change their demographic profile and prosperity rises in these market demands models predict that number of vehicles on road and fuel consumption by transportation sectors are likely to rise.
But such demand models get one thing wrong. With new found wealth growing middle class in these markets is not likely to make the same choices as US consumers. Tax incentives, local automobile production, fuel efficiency, traffic congestion, parking and garage availability, spare parts, social preferences, size of household, propensity to save versus consume are all parameters that define whether a family is likely to purchase a vehicle or not. Indian, Chinese and African consumers are likely to make different choices compared to their North American counterparts. Rather than Trucks, Jeeps, Sports utility vehicles, Camry or Accords, they are more likely to opt for much smaller footprint Fit, Vitz, Nano, Leaf and Aquas. Beyond consumer choices, expected improvement in engine efficiency and mileage per gallon driven by emissions control are likely to negate any uptick in demand caused by more vehicles on the road.
The second candidate for growth is industrial consumers. Mechanization and manufacturing capacity build up in emerging and frontier markets implies more energy usage. While the case here is much stronger compared to transportation, industrial customers are also likely to opt for efficient and low cost fuel mix. There is also an upward industry migration effect. For instance, China is moving away from energy intense applications in cement and steel to lower intensity industries in consumer goods and electronics. This decision is going to be a function of how their national grid is set up and is likely vary from one country to the next.
The third and final component is residential and commercial customers. The energy consumption foot print across seasons in Africa and India is very different from North America and Europe. We are not saying prosperity is not going to lead to rising living standard in emerging economies. We are simply saying that the energy bill for countries with mild summers and milder winters is going to be different. Certainly more load on the electrical grid but not higher demand for heating oil or natural gas for warming up homes.
All this before we start looking into concerns about slowing growth in China and India. The Chinese economy is already undergoing consolidation in view of new tariffs and threat of a trade war with the US. There are also concerns about a slow down on account of credit losses and a wave of subsequent structural changes likely to eat into projected demand. Sales figures for automobiles, residential homes and other capital goods are slowing down. India begins its preparation for elections in 2019 that are likely to be closely contested. The uncertainty leading into elections cycles is likely to defer and delay investor decision making. Both markets are likely to hit a short but possibly temporary slowdown in 2019.
If EIA US projections are a precursor of anything it is demand for liquid fuels is likely to shift lower in coming years. Not just in 2019. Renewable energy sources are likely to get cheaper and more appealing. Demand for liquid fuels in three primary sectors – power generation, transportation and industrial customers – is likely to drop. This is not just based on EIA annual energy outlook. BP’s analysis in its published annual outlook leads to similar conclusions. In the long run (2019-2040), global energy demand is likely to grow at a modest 1% – 1.2% a year. Down from the heady 2.5% witnessed in the last decade with China and India spreading their wings. There is broad consensus across energy industry about long term growth outlook whether you speak to Exxon, Standard Oil, China National Petroleum, OPEC or IEA in addition to BP and EIA. We will see demand for more energy driven by global growth in coming years but it may not translate into demand for more barrels of crude oil.

A quick look at global demand projections in OPEC’s December 2018 monthly report gives us sense of expected growth in 2019. India, Africa and China will respectively add 190, 110 and 340 thousand barrels a day to global demand in 2019. US is likely to add 240 thousand barrels a day. If all four economies continue their anticipated growth trajectory.
While Africa is likely to stay on course, elections in India are likely to have impact on Indian growth projections. Chinese and US tariff and trade row has already had impact on growth prospects of both economies. With US government shut down over funding for Mexican border wall growth projections for US economy in 2019 will take a hit. Expected to last well into January (possibly early February) the shutdown is estimated to shave GDP growth by 0.1% per week according to the Chair of the President’s council of economic advisors.
By OPEC’s original projections global demand is likely to grow by 1.29 million barrels per day in 2019 at current price levels. Of which 0.88 million barrels per day (68%) is associated with the four economies identified above.