What does the data say about crude oil price direction?
Enough about the context. What about data? Are there any signals that can hint towards the shape of things to come for oil prices?
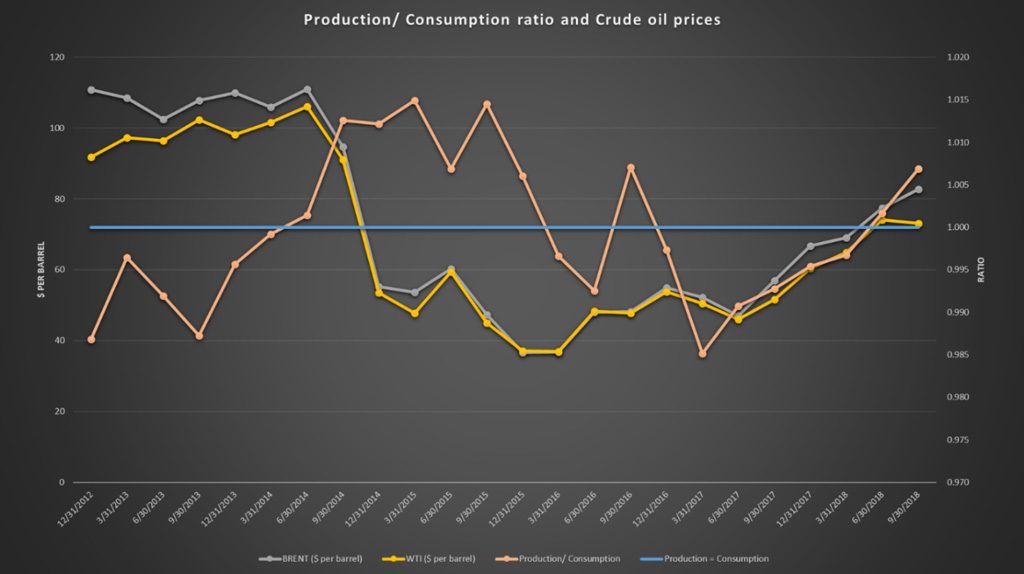
Let’s begin with production and consumption ratio. It’s a simple tool. It takes global production of crude oil and divides it by global consumption. A value greater than one indicates over supply or glut. A value less than one indicates shortage.
How has the ratio behaved in the past? Plot 2014 price and production / consumption ratio and compare them with 2018 figures. We do that below. The blue line plotted horizontally at 1.0 is the threshold for the ratio.
Throughout June 2014 to December 2015 the ratio trended above 1 and prices remained depressed. They started falling in September 2014 and were officially in bearish territory by December of that year. It took two rounds of cuts for the ratio to drop below 1.0 and after the second cut as long as it stayed below 1.0 prices behaved.
As soon as the ratio moved up again beyond 1.0 in June 2018 prices tumbled again. Remember that. Two rounds of cuts. Not one. Also multiple quarters with the ratio reading below 1.0 for prices to take notice and adjust. With the ratio currently trending above one, we have a bearish, not bullish signal.
OPEC+ production cuts announced in December, when completed will take 1.2 million barrels off the market. If prices don’t stabilize at higher levels, Saudis plan to cut more. A December 2018 and January 2019 read for the ratio will give us a better sense for how the ratio has adjusted for the cuts.
An extension of the same analysis is correlating percentage changes in crude oil production with impact in percentage terms on oil prices. The next graph presents that trend.
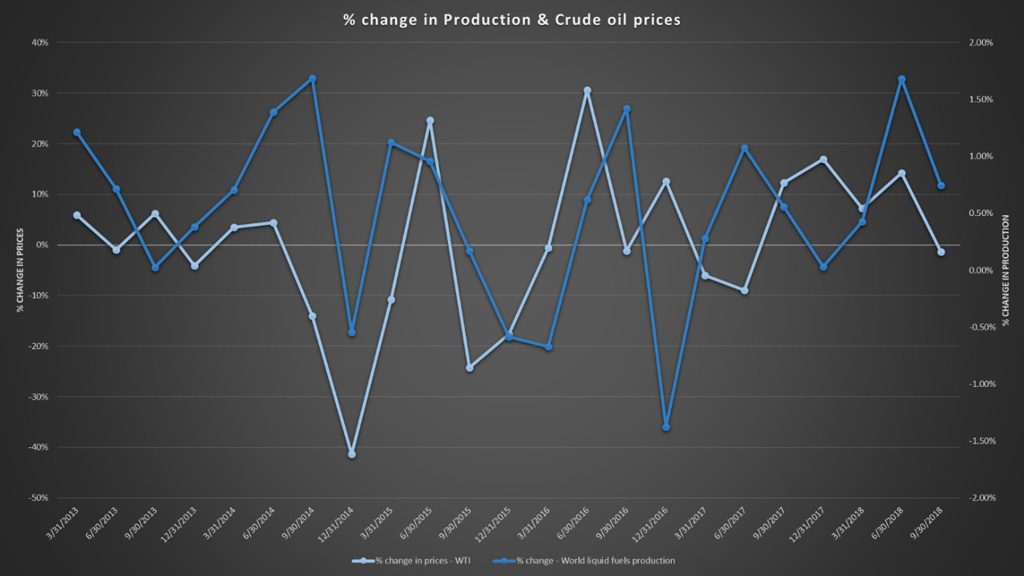
Once again we observe a similar relationship. Prices drop with swings of up to 1% in productions but need deeper cuts for them to rise again. A cursory read of the above graph suggests that based on end of year production levels, OPEC+ cuts would need to be 2 to 2.2 million barrel per day for them to have a noticeable effect on prices.
OPEC+ December 7 cuts provide the first 1.2 million barrels. The impact of Iranian sanctions by April 2019 when current waivers on imports of Iranian oil expire should provide the other million barrels. If the sanctions stay and bite markets should be able to find balance. If waivers are extended in April we will be back in oversupply territory.
OPEC Spare capacity. While the cuts certainly help, they show up in a different way on the OPEC space capacity graph. OPEC space capacity stood at 1.5 million barrels before the December cuts. Adding the impact of Iranian sanctions by April 2019 it will stand at 3.2 million barrels, a level not see post June 2011. This is before anticipated production gains in other OPEC economies.
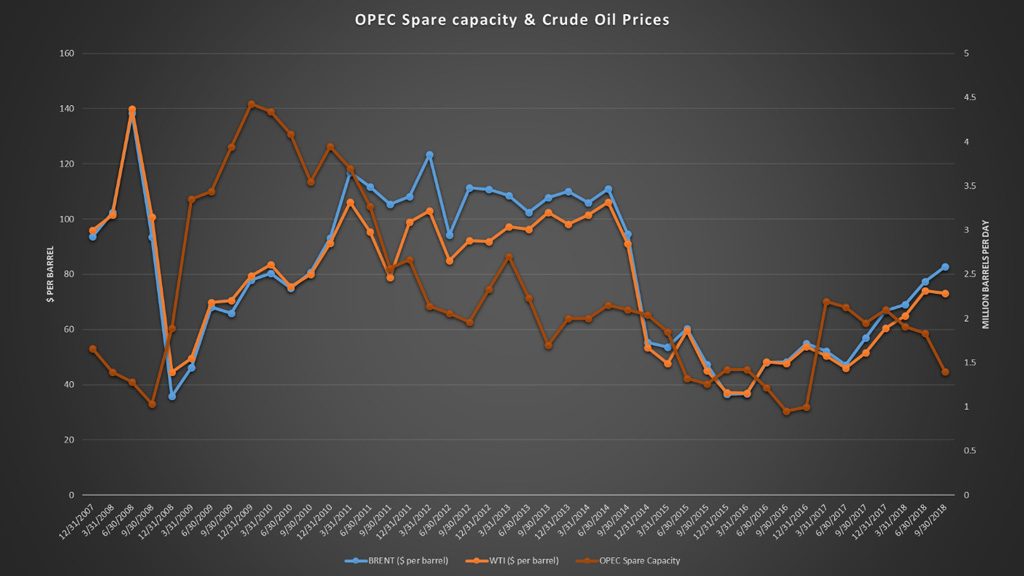
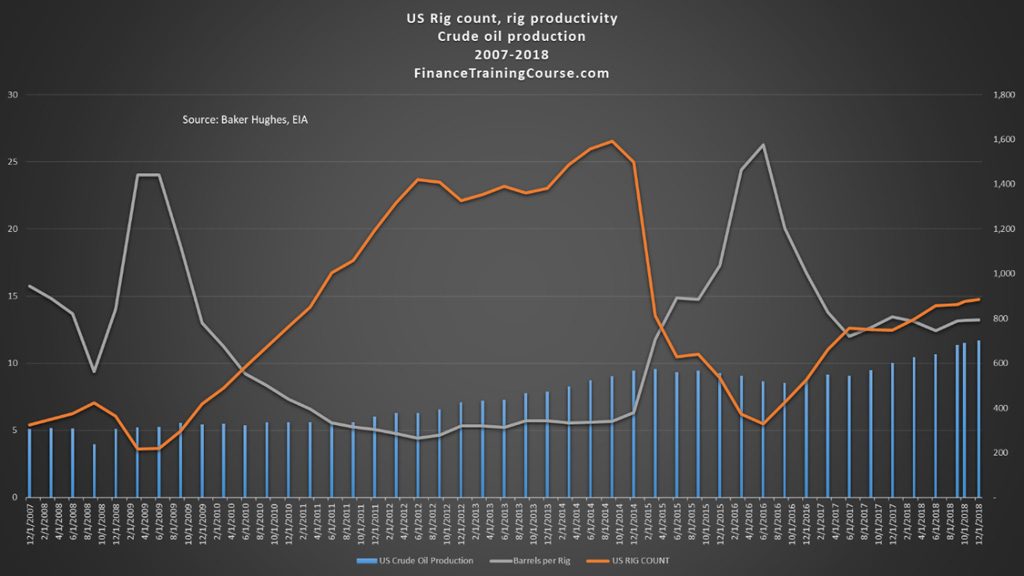
While spare capacity plot below shows this to be beneficial for prices, we have to factor in impact of US oil production and its projected growth. US production stood at 5.6 million barrels per day in 2011 and at 11.9 million barrels per day in December 2018. As per updated EIA forecasts it is likely to cross 12.4 million barrels in 2019. Which implies despite OPEC+ cuts and Iranian sanctions it would be difficult to get markets to balance before the third quarter of 2019. Prices are likely to remain under pressure throughout 2019.
There may be short periods of recovery when markets react to good news on US China talks on trade tariffs (an early resolution would be good for global growth) or still deeper cuts pushed by Saudi Arabia. Or despair if inventories build up, US production unexpected gains surprise with an upside or release of more depressing economic news out of China.
Spreads on future contracts on WTI between the 4th month (June) and the front month (February) though are looking positive. Historically from the plot below when spreads turn negative we see a decline in prices in future months. They dropped in September 2018 and we saw the impact in spot prices in December. In January they are looking positive so far implying potential price stability between now and June 2019.
A quick caveat though. Just because spreads are positive in January doesn’t imply that we will see an improvement in prices or lower volatility. All that implies is that using today’s future prices you could lock in your price levels at a slight premium to spot prices today for the next four months. The actual price in April or June may be very different from the one implied by current future contract prices for those months.
What about traded volumes on front month contracts? How have traded volumes changed over the last ten years, especially before and after a price crash?
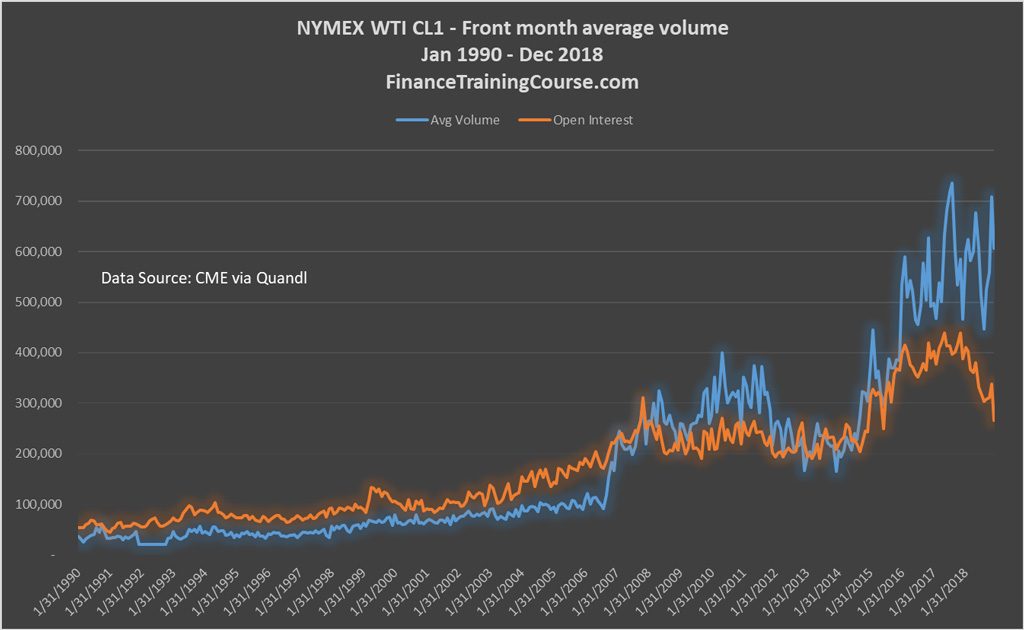
Average daily traded volumes for front month contract (NYMEX WTI) moved from 165,000 contracts per day in December 2013 to 700,000 contracts per day in December 2018. A fourfold increase over five years. When was the last time we saw such a move?
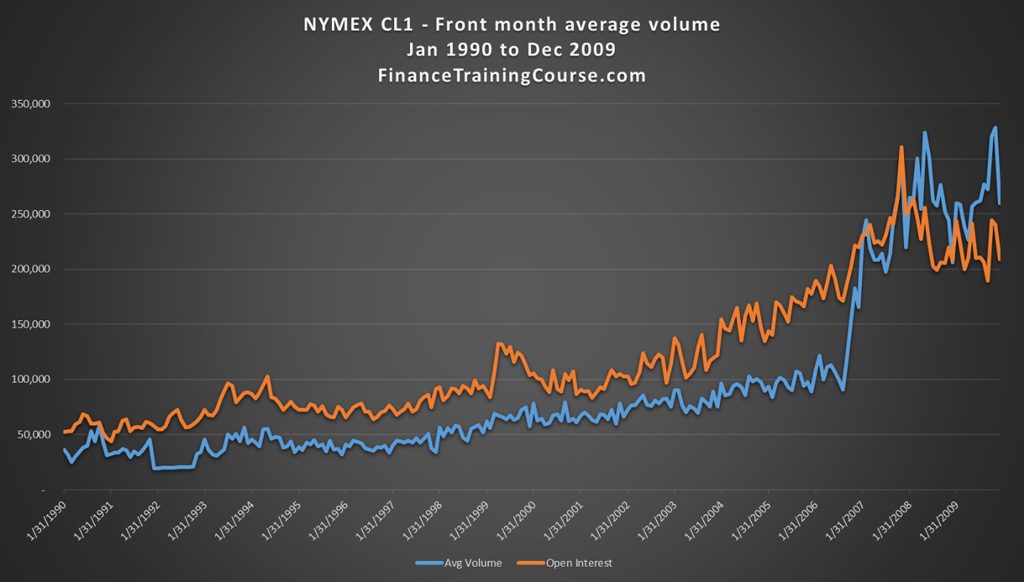
You guessed it. 2007-2008. From 2000 to 2007 average daily volumes doubled from 50,000 contracts per day to 100,000 contracts per day and then jumped again to 323,000 contracts by May 2008. Prices crashed within six months of the jump.
Are we seeing a repeat performance of the same phenomenon? Let’s look at the same data from another perspective.
In the five-year period from December 2013 to December 2018, global production of liquid fuels increased from 92 million barrels per day to 99 million barrels per day. An increase of less than 7.6% over a five-year period. However, trading volumes on NYMEX WTI future contracts jumped by 426%.
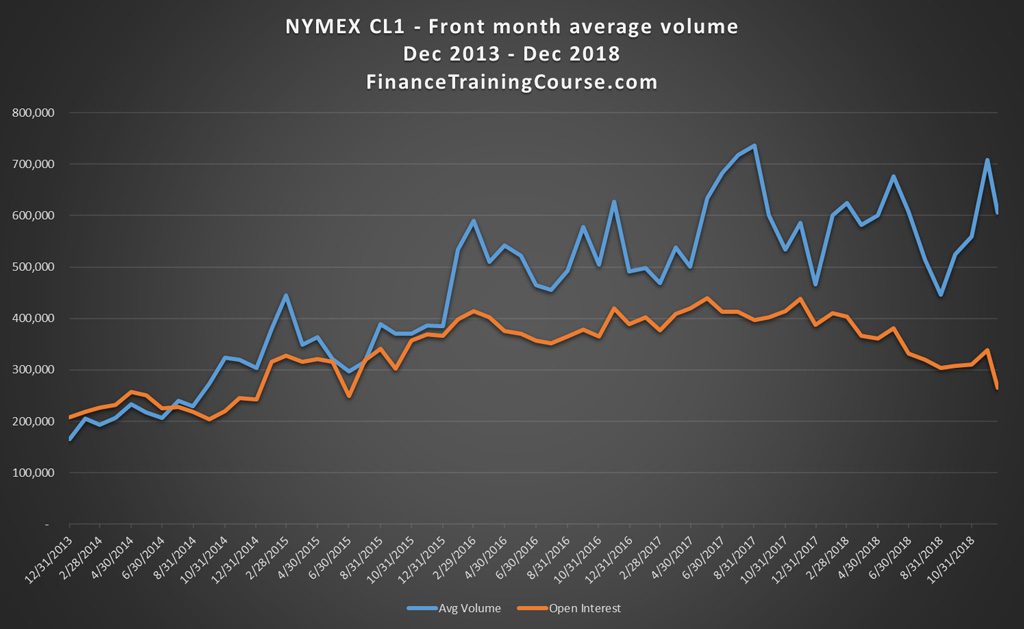
The shift happened in two steps. A jump in volumes from December 2013 to February 2016 and then from September 2016 to August 2017. What drove this change? Reallocation of risk and trading capital to crude oil once again or something completely different?
Two factors. Higher US crude oil production (from 6 million barrels per day in December 2011 to 11.9 million barrels per day in December 2018) and growing exports of crude after a US ban on oil exports was lifted in 2016. After years of international isolation and limited supply US crude is making a comeback to international financial markets. According to CME Group 30% of this new trading volume is international customers hedging their oil exposures using NYMEX WTI contracts. Which explains why the increase in volume though higher in magnitude is more gradual this time compared to 2007.
Conclusion
A mix of both bullish and bearish signals.
- OPEC spare capacity is bullish when looking at historical data plots. But those plots can’t factor in record breaking US production levels.
- Future trading volumes are bearish but that bearish doesn’t account for the fact that production volumes are higher and US crude is now being exported to international customers who are using financial markets to hedge prices.
- Production to consumption ratio is bearish. Side by side by production changes and price change plots it indicates that we would need one more deep production cut to balance the market.
- Future spreads are stable to bullish in the short term but they can switch sides fairly quickly.
Its time to take a look at some more context to figure out how to translate these signals.