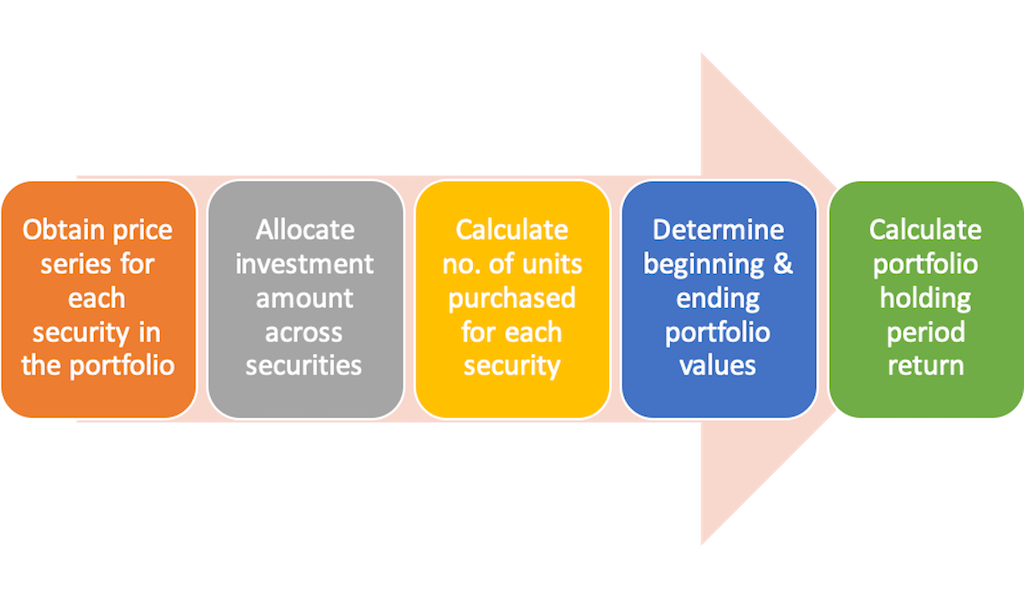
How to calculate portfolio holding period return
To determine holding period return of a portfolio we require values of portfolio at start and end dates of holding period. Portfolio value at any given time is the sum across securities of number of units in a given security times price of that security, where number of units purchased for a given security depends on notional investment amount allocated to the security.
A detailed walk through of the calculation is given below. Before we proceed let us look at the assumptions we make in the calculations:
- Our first assumption is that the number of units remain unchanged during holding period. This implies a buy and hold strategy i.e. the fund manager does not rebalance his portfolio for number of units purchased during the duration of holding period.
- Secondly, we assume that in markets investors operate fractional trades are possible and readily available. This ensures that it is possible to purchase fractional units of the security.
Step one – Obtain price time series for each security being assessed for portfolio
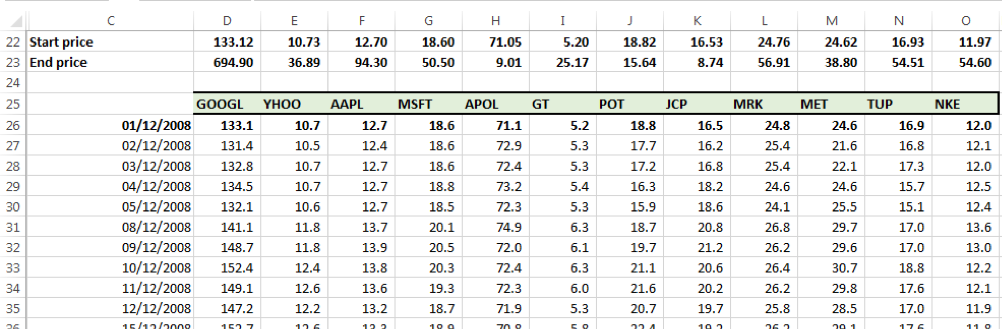
We obtained prices for 12 securities across 1st December 2008 to 30th June 2016 (Dataset 1).
| GOOGL |
| YHOO |
| AAPL |
| MSFT |
| APOL |
| GT |
| POT |
| JCP |
| MRK |
| MET |
| TUP |
| NKE |
We take 01-12-2008 to be the start date of the holding period and 30-06-2016 to be the end date of the holding period.
Step two – Allocate the notional investment value to each security
We assume that we have $1000 that we need to allocate according to the following percentages:
| GOOGL | 25% |
| YHOO | 0% |
| AAPL | 0% |
| MSFT | 4% |
| APOL | 0% |
| GT | 0% |
| POT | 25% |
| JCP | 25% |
| MRK | 4% |
| MET | 0% |
| TUP | 17% |
| NKE | 0% |
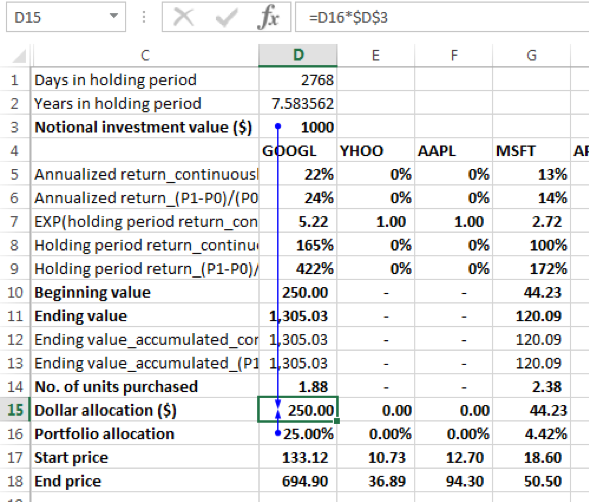
This means that the $1000 notional investment is allocated to the 12 securities as follows (dollar allocation = allocation % x notional investment amount):
| GOOGL | 250.00 |
| YHOO | – |
| AAPL | – |
| MSFT | 44.23 |
| APOL | – |
| GT | – |
| POT | 250.00 |
| JCP | 250.00 |
| MRK | 38.85 |
| MET | – |
| TUP | 166.91 |
| NKE | – |
Step three – Determine the number of units purchased on the start date of the holding period
While step two determines the amount of dollar allocation to each security, we need to now calculate the amount of units that were purchased for each security. This is a function of the dollar allocation and the price on the date of purchase, in this instance the start date of the holding period, i.e. 01-12-2008. In particular:
Number of units purchased = Dollar allocation / Price on start date of holding price.
As mentioned earlier our underlying assumption here is that the investor is able to purchase fractional units of shares. This is a simplifying assumption. In reality, there could be restrictions on the number of units that can be purchased.
For GOOGL the price per share was $133.12 on 01-12-2008. The dollar allocation was 250. Hence the number of units purchased of GOOGL was 250/133.12 = 1.88 units on this date.
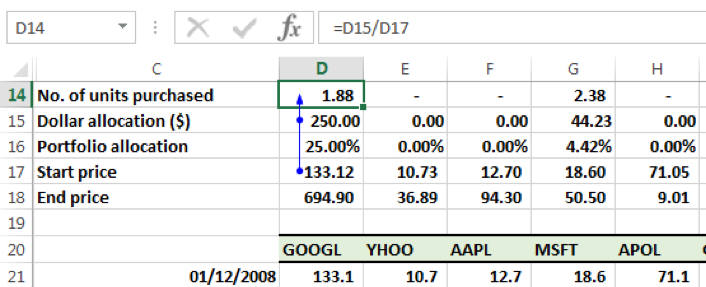
The units purchased for the remaining securities on 01-12-2008 as per our allocation model were:
| GOOGL | 1.88 |
| YHOO | – |
| AAPL | – |
| MSFT | 2.38 |
| APOL | – |
| GT | – |
| POT | 13.28 |
| JCP | 15.12 |
| MRK | 1.57 |
| MET | – |
| TUP | 9.86 |
| NKE | – |
Step four – Determine the portfolio values at the start and end of the holding period
Beginning portfolio value (P0)
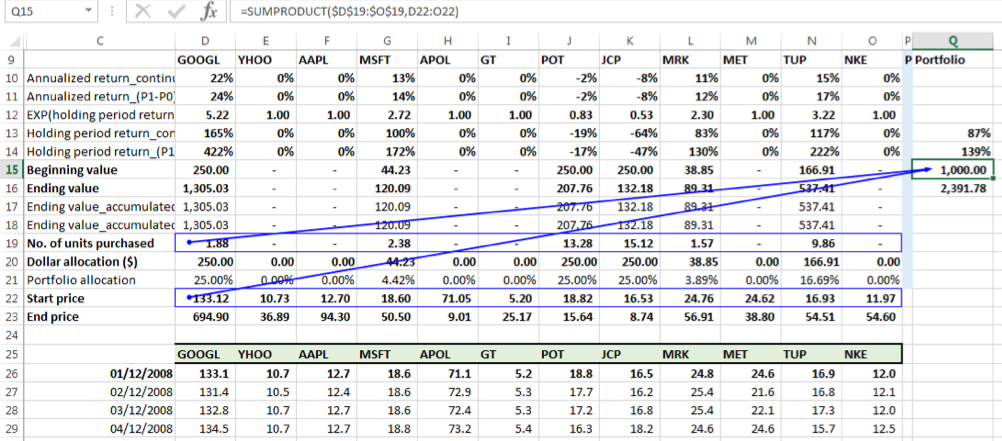
Given that the notional amount is allocated among the selected securities on the start date of the holding period, the beginning portfolio value on this date should equal the notional value of the investment on that date, i.e. $ 1000. We can verify that this is the case by taking the SUMPRODUCT of the number of units and price on 01-12-2008 across the 12 securities:
Ending portfolio value (P1)
In a similar manner, the portfolio value at the end of the holding period is found by taken the SUMPRODUCT of the number of units and the price on 30-06-2018 across the 12 securities:
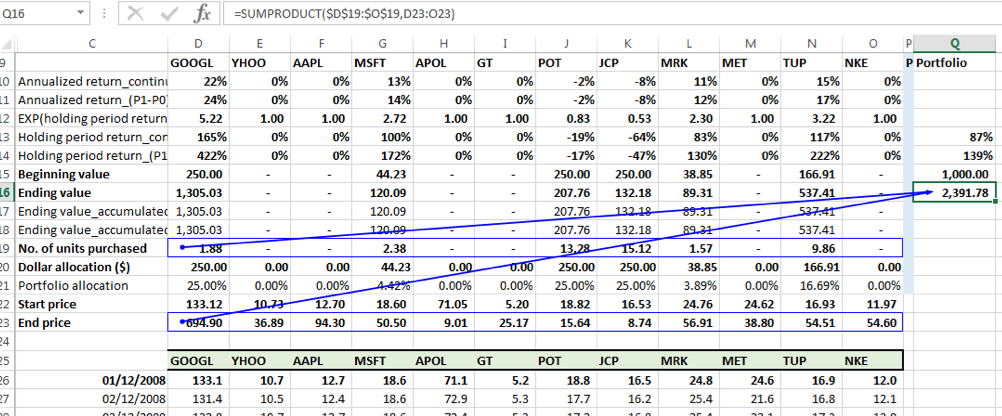
The portfolio value on the end date = $2,391.78
Again note, the number of units remain the same as those purchased on the start date of the holding period.
Step five – Calculate the holding period return for the portfolio
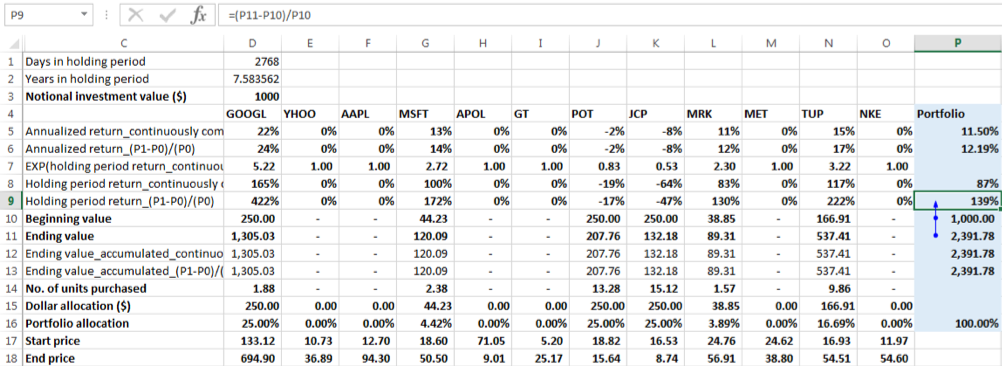
Using the formula (P1-P0)/(P0):
For ease of reference let us call this rate of change formula the linear growth formula. Portfolio holding period return (Aggregate return) = (Ending portfolio value – Beginning portfolio value)/ Beginning portfolio value = (2391.78 -1000)/1000 = 139.18%
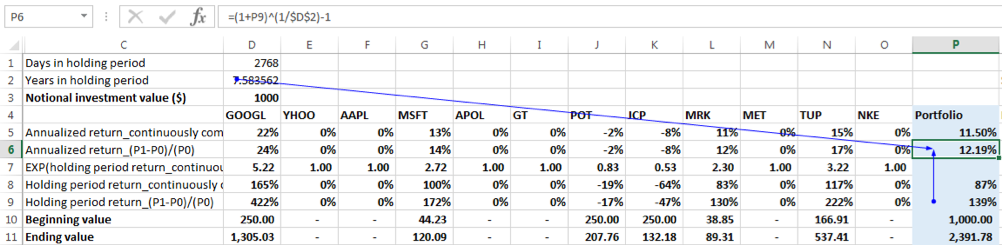
There were 7.58 years in the holding period, so the annualized return is:
Annualized return = (1+ 139.18%) ^ (1/7.58)-1=12.19%
Using the continuously compounded return formula:
Portfolio holding period return = natural log of (Ending Portfolio Value / Beginning Portfolio Value) = ln (2391.78/1000) = 87.20%
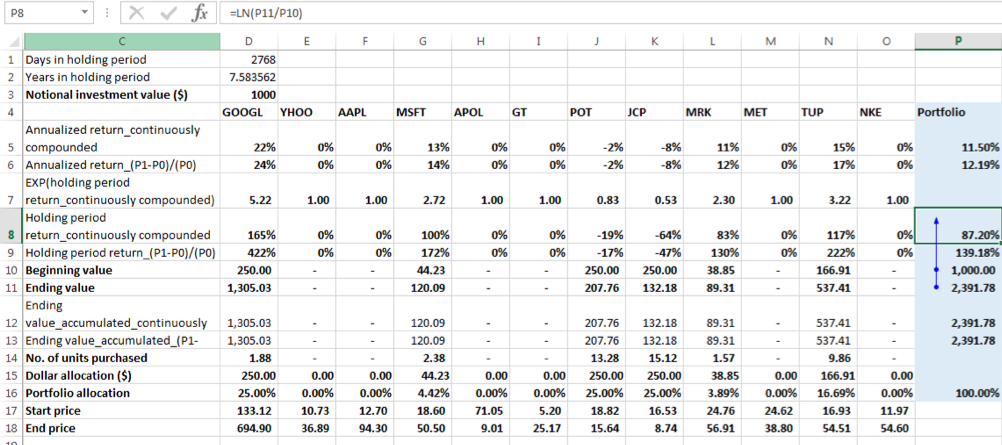
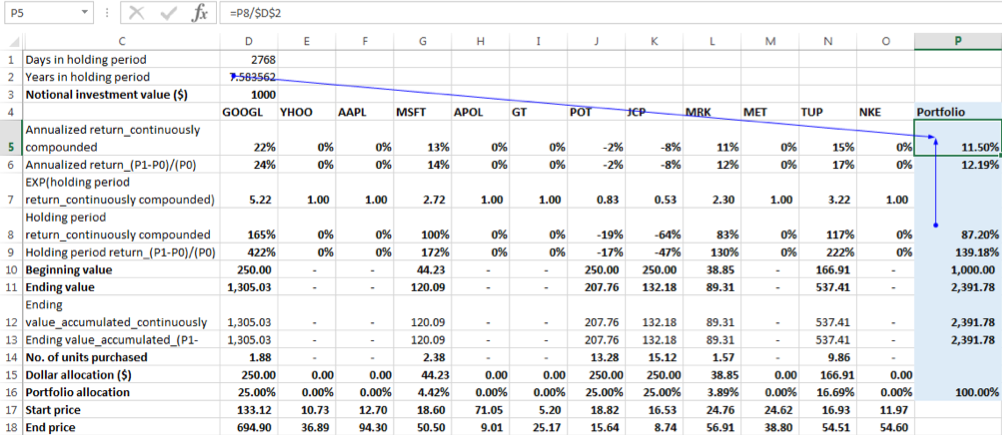
The annualized return = 87.20%/7.58 = 11.50%
To check for equivalency between compounding methods we see that annualized return compounded continuously = ln (1+ annualized return using the linear growth formula) = ln (1+12.19%) = 11.50%
Alternate approach to calculating holding period returns for the portfolio
Another way to calculate or in turn verify the holding period return for the portfolio is to:
1. First, calculate the end value of the dollar allocation for each security by accumulating its allocated notional dollar amount or beginning value to the end date of the holding period using that holding period return.
Note: The holding period for each security is calculated using the same process as mentioned above for the portfolio, i.e. based on the beginning and ending values of each securities. These values are derived using the formula: Number of units purchased x Price of the security on the respective start and end dates of the holding period. Also, note that the beginning value of each security is equal to the dollar amount allocated on the holding period start date.
Using the linear growth formula, (P1-P0)/(P0):
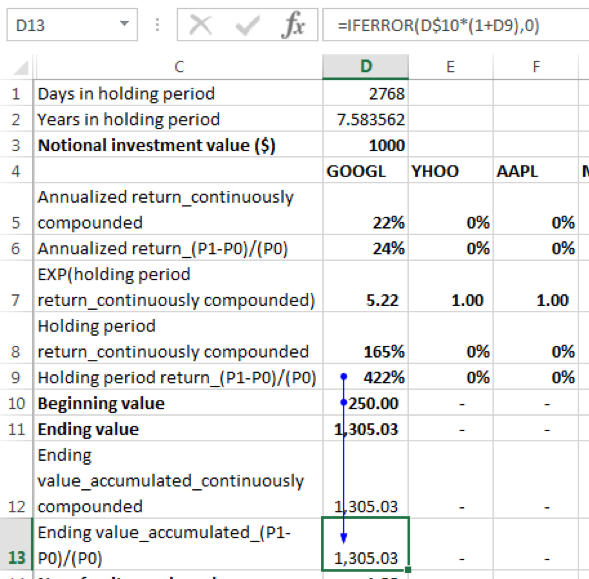
The ending value [for GOOGL] = beginning value x (1+holding period return) = 250 x (1+422%) = 1305.03. The conditional IFERROR function has been added to the formula because EXCEL will return an error in cases where allocation to a given security is 0%. With the conditional formula in such instances, the holding period return will result in a value of 0.
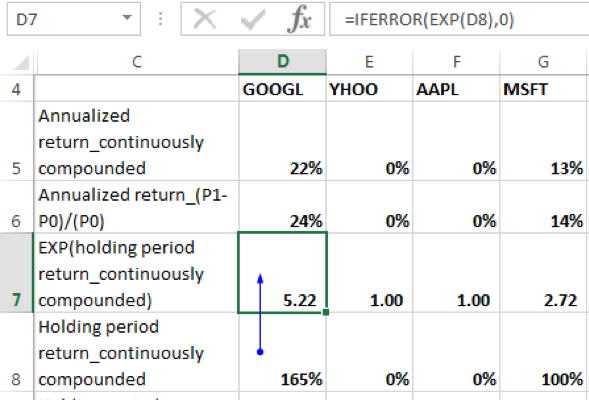
Using the continuously compounded return formula:
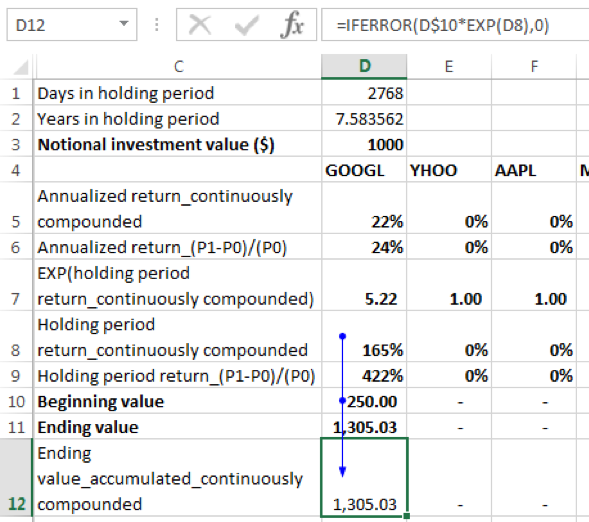
The ending value [for GOOGL] = beginning value x EXP (holding period return) = 250 x EXP (165%) = 1305.03. EXP() is the exponential function in EXCEL. Again, the conditional IFERROR function has been added to the formula because EXCEL will return an error in cases where allocation to a given security is 0%. With the conditional formula in such instances, the holding period return will result in a value of 0.
2. Second, summing the ending values across securities to determine the ending value of the portfolio
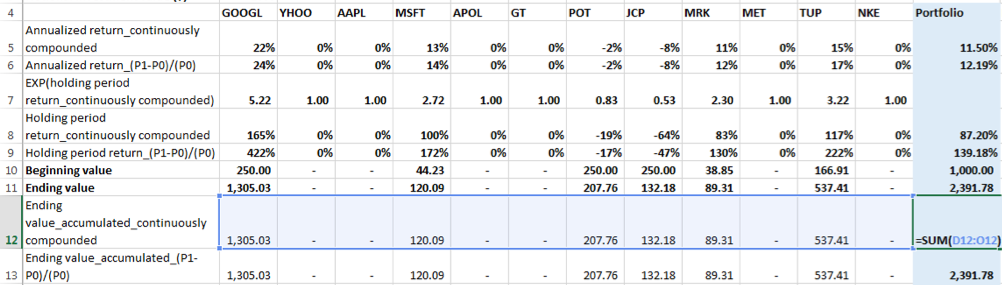
The sum for either accumulation method, linear growth or continuously compounded should give the same result for the ending value of the portfolio, i.e. $2,391.78
3. Third calculating the holding period return for the portfolio
Using the formula (P1-P0)/(P0):
Portfolio holding period return (Aggregate return) = (Ending portfolio value – Beginning portfolio value)/ Beginning portfolio value = (2391.78 -1000)/1000 = 139.18%
Using the continuously compounded return formula:
Portfolio holding period return = natural log of (Ending Portfolio Value / Beginning Portfolio Value) = ln (2391.78/1000) = 87.20%
Portfolio return & SUMPRODUCT of individual returns & allocations
While the above methodology in the previous section yields the portfolio holding period return, one question that kept coming up was whether or not the SUMPRODUCT of individual securities holding period returns and the allocation percentages would equal to holding period return of the portfolio as calculated above?
Let us calculate the SUMPRODUCT to answer this question:
Holding period returns using the formula (P1-P0)/(P0):
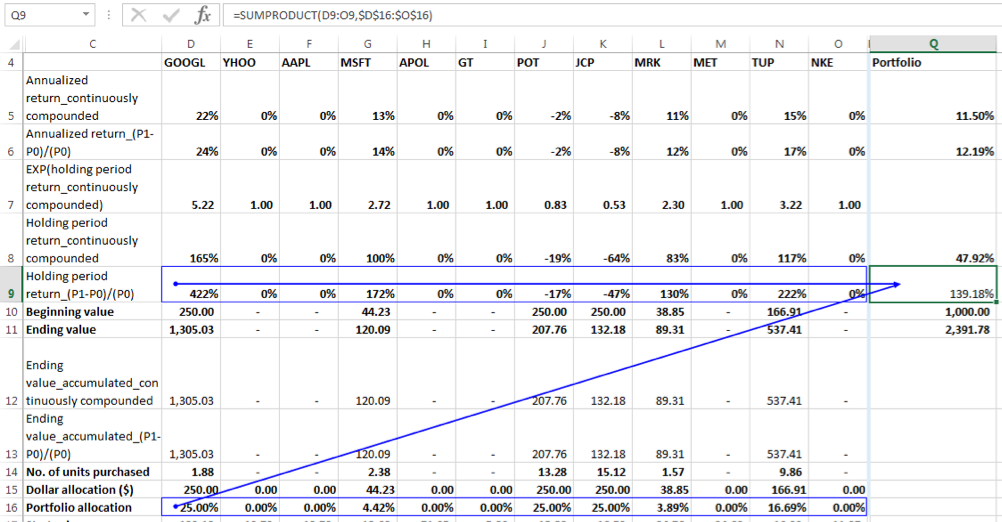
We can see that the SUMPRODUCT gives a very close approximation (139.1780907% against exact value of 139.1780899%) to the actual value of the portfolio holding period return when holding period returns are calculated using the linear growth formula for rate of change. This is because:
Ending Value of Portfolio = Beginning Value of Portfolio * (a*(1+r1) + b*(1+r2) + c* (1+r3) +…) = Beginning Value of Portfolio * (a + b + c…+ ar1+br2+cr3+…)
Where a, b, c,… are the allocation percentages such that a + b + c+…= 1 , i.e. the notional amount is fully invested.
r1, r2, r3, … are the holding period returns for security 1, security 2, security 3, …
Rearranging the equation we have Portfolio Holding Period Return = (Ending Value of Portfolio – Beginning Value of Portfolio)/Beginning Value of Portfolio = Ending Value of Portfolio/Beginning Value of Portfolio – 1 = a*r1+ b*r2+ c*r3+… i.e. the Portfolio Holding period return is equal to the weighted average holding period returns of the individual securities with weights equal to the allocation percentages or in EXCEL terms the SUMPRODUCT of the holding period returns of the individual securities and their allocation percentages.
Holding period returns using the continuously compounded return formula:
Is the same true when we use holding period returns calculated using the continuously compounded return formula? Let us see below:
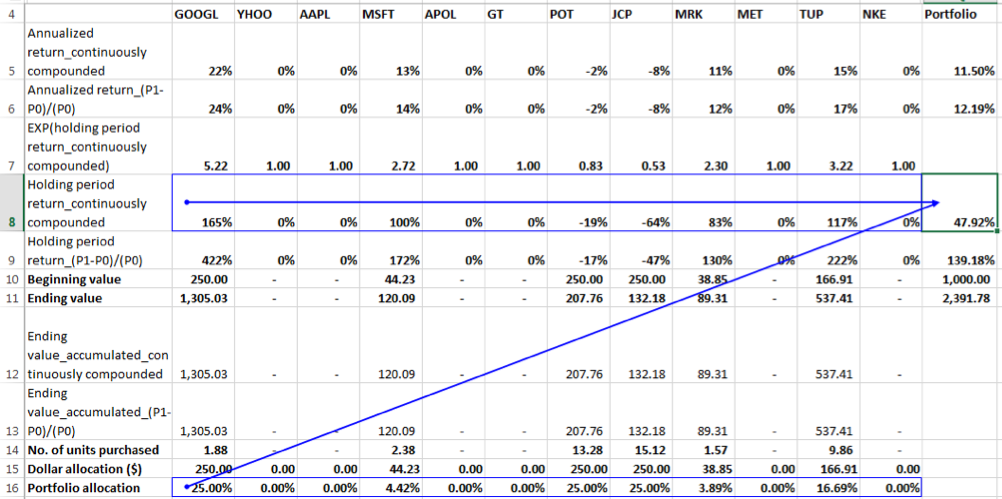
We can see that the SUMPRODUCT of individual securities holding period returns and allocation percentages is not equal to the Portfolio Holding Period Return of 87.20% in this instance. Why is this? Let us look at the formulation of the Portfolio Ending Value derived from individual portfolio ending values as follows:
Ending Value of Portfolio = Beginning Value of Portfolio * (a*EXP(r1) + b *EXP(r2)+c*EXP(r3)+…)
Where a, b, c,… are the allocation percentages such that a + b + c+…= 1 , i.e. the notional amount is fully invested.
r1, r2, r3, … are the holding period returns for security 1, security 2, security 3, …
Rearranging we have, Portfolio Holding Period Return = ln (Ending Value of Portfolio/ Beginning Value of Portfolio) = ln (a*EXP(r1) + b *EXP(r2)+c*EXP(r3)+…)
Clearly, we can see that the portfolio holding period return in not equal to the weighted average of the individual securities holding period returns when returns are calculated using the continuously compounded return formula.
To calculate an approximate holding period return for the portfolio however we can do the following:
4. Determine the exponent of the holding period return for each security:
5. Determine the weighted average exponents of holding period returns of the individual securities with weights equal to the allocation percentages. In EXCEL terms this is calculated as the SUMPRODUCT of the exponents of holding period returns of the individual securities and their allocation percentages.
6. Determine the portfolio holding period return approximation as the natural log of weighted average calculated in the prior step.
Steps (2) & (3) are combined in the formula show below:
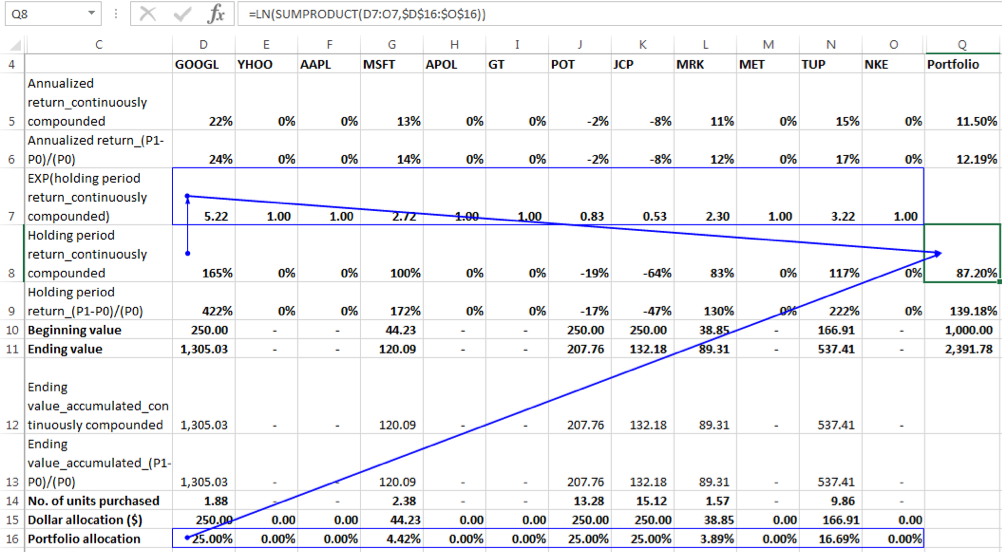
The result is 87.2038240% as compared to the actual value of 87.2038234%.