Disney Marvel questions.
On Saturday, 27th April, as credits rolled on the screen and I walked out of Avengers Endgame late afternoon show, I kept on thinking the same thoughts. What kind of talent does it take for a business to play the long game like Disney played its Marvel cards? They had me and my three children under their spell for 22 titles across 11 years. Not just me but the entire middle class plus demographic across the globe wrapped up around their little finger. Rooting for characters and heroes from a world that my kids had never witnessed, experienced or lived in. 21 billion dollars from a superhero franchise that a decade ago had no major following outside of the nerdy, geeky, oft ignored comic book and graphic novel community. Who saw this coming? I certainly didn’t. How did Disney see the value Marvel brought to the table all the way back in 2008-9 or even earlier according to some credible accounts? To be more specific, who, not how. The architects with vision and the ability to engineer organizational commitment like this tend to be individuals, not groups. Who gets the credit for the content heist Disney managed to pull? I would certainly like to shake the hand of that man (or woman). And finally, the question that nagged me the most. How much of that 21 billion dollars actually made it to Disney’s bottom line?
I knew it was time for another deep dive. These were great questions and I wouldn’t be able to focus on anything else till I found their answers. I was not the first one to walk this path and there was data strewn around if one was willing to look. This would be a story worth exploring, one worth writing.
Disney Marvel MCU. How much money did Disney make?
How to play the content game?
For content startups everywhere Disney’s character acquisition and integration model is a great starting point. Disney’s Marvel Entertainment integration has many lessons to teach. Leveraging existing platforms, extending the core character universe, adding eleven years to the life of the original storyboard, hyper-monetizing minor sidebar characters by carefully scheduling their film release dates, wait time between installments, each film increasing the marginal value of releases that follow and staying true to core audience interest and high quality storytelling. It’s not an easy job. All you have to do is look across the road at the disaster in the making that has been the WB/DC universe. Compare the brilliance of Dark Knight series with the hit and miss Justice league and you could see that having a character library, hiring respected directors with a track record and money to burn is not enough to make it in this business.
Unlike other Disney acquisitions (Pixar, Miramax and Lucas Films) the independent existence of Marvel Cinematic Universe (MCU) gives us a great lens to examine the value of Disney platform. Pixar and Miramax are known for their individual releases, most quite successful compared to the batting average of the film industry. Lucas Films came with a character universe into Disney’s orbit a few years after Marvel but didn’t compare as favorably when it comes to box office draw. Marvel had all the right ingredients – a character rich universe, a series of titles and broad audience appeal.
Why is this an interesting question worthy of examination? It helps put a value on future acquisition targets once you understand the Disney formula. It quantifies the incremental value Disney adds to a brand. If you plan on competing with Disney it gives you a handle on Disney’s playbook. It becomes even more interesting when you see the coming clash between Disney, Netflix and Amazon as they converge on the same path. When the dust settles ten years from now, which of the three will be left standing?
How much money did Disney make from Marvel?
How much money did Disney make over the last eleven years from the Marvel Cinematic Universe? 22 films released, eight with global box office receipts of a billion dollars, two with more than two billion dollars. How much did each individual MCU title generate in global box office receipts?
Here are the gross figures. First in the form of a graph so that you can see how each Avenger release reset the bar for the next one.
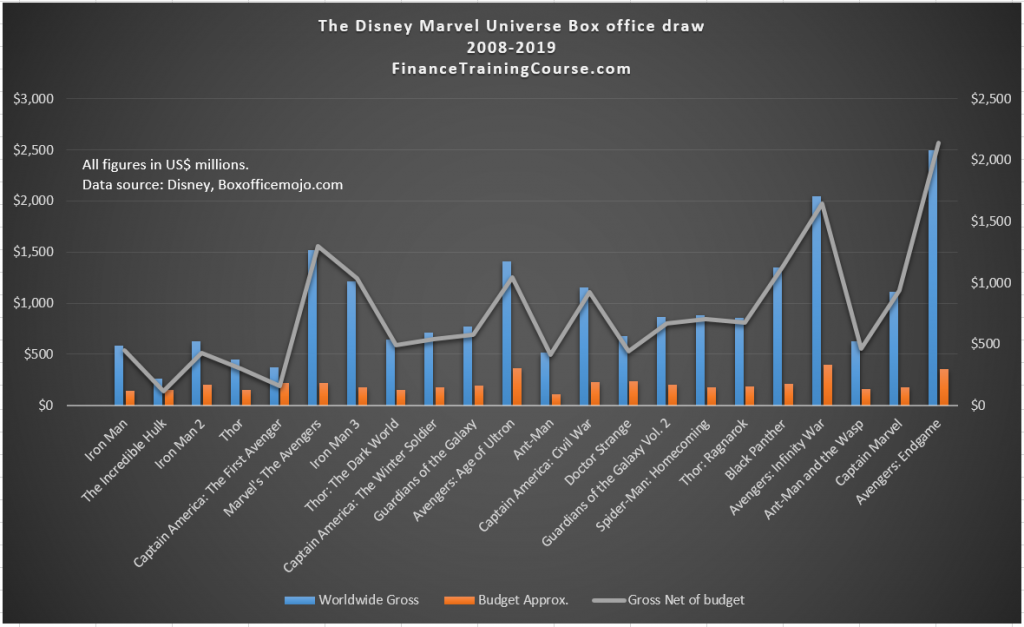
The movie business has many driving components and film accounting is a complex puzzle for outsiders. If a simple answer, “Yes, they certainly made enough”, is satisfactory we can stop here. Disney made enough money on the Marvel deal.
But if you want to ask how much value did Disney add by bringing Marvel under the fold, we need to do a bit more work? We have to seek the unanswerable question. How much money did they make on each film? Let’s take a look.
Disney Marvel Acquisition.
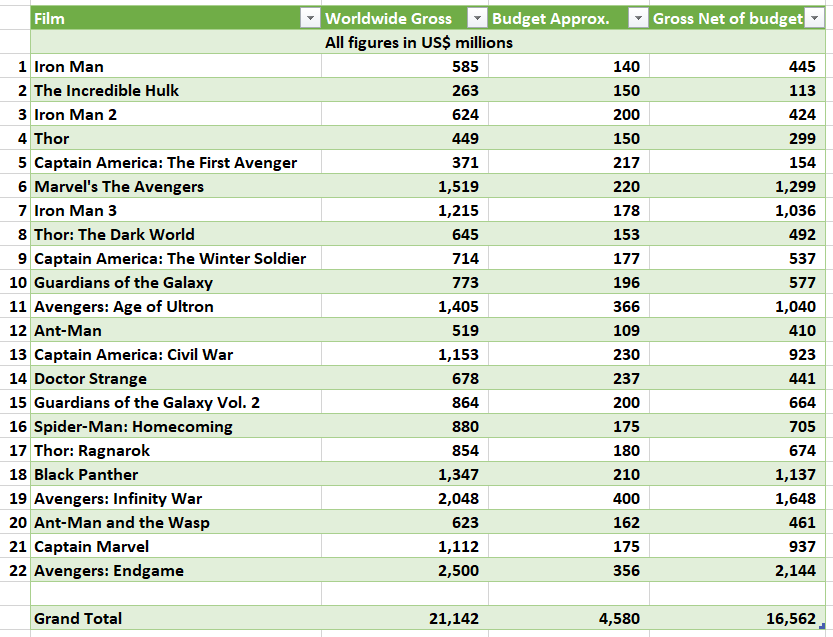
Disney paid USD 3.8 billion for Marvel Entertainment in August 2009. Between 2009 and 2019 Disney released 21 films in the MCU. Iron man, the first film in the series was released while Marvel was still independent. In addition to its initial investment, Disney put up an additional USD 4 billion in producing the 21 films.
A simplistic analysis suggests that Disney invested USD 7.8 billion into the franchise. How much did Disney get back? Tabulation based on the table below suggests that the answer is USD 16.56 billion net of production costs as at the date of writing of this note.
Is that a correct estimate of how much money Disney made? No.
To understand Disney profitability, we have to dissect the film accounting model. We use a simplified template that can serve as a proxy for the real world. A qualification before we get our hands dirty.
While the parameters change from one film and one studio to another, the line items remain the same. This is a simplified presentation that links derivative items to global box office receipts. Real life is not that simple. This is just illustrative guess work based on a review of Disney’s financial statements, comments and feedback from professionals in the media industry and a few lucky guesses. We didn’t hire Tom Cruise, or the team at IMF, hack into Disney head quarter or kidnap the current Disney CFO to get these answers. We are most likely off by a large margin but it is still a better guess than our first shot at the how much answer.
Let’s start.
Film accounting – simplified financial model.
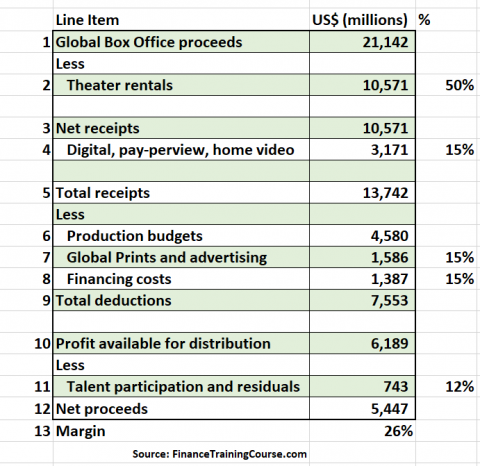
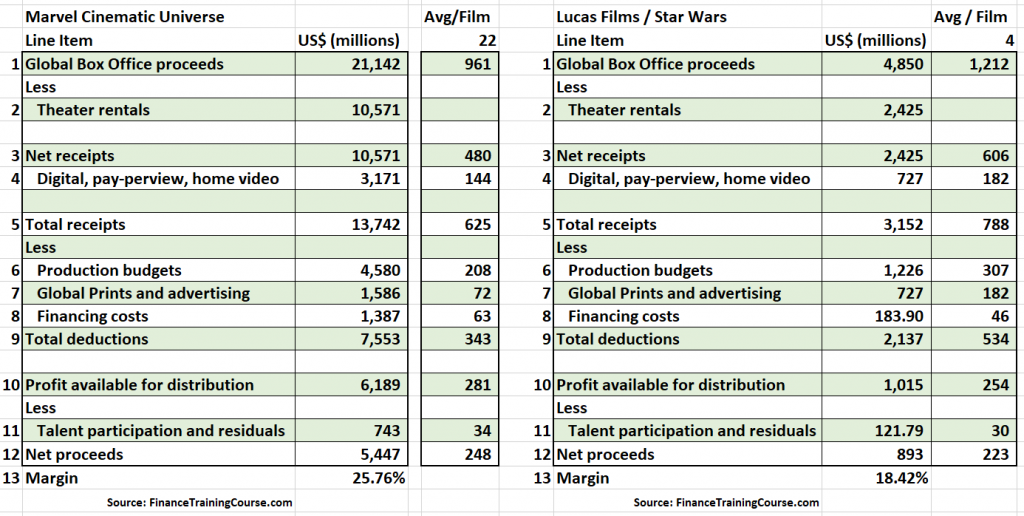
The starting point is global box office receipts, line item number one. This is generally broken down into domestic (US), China and International.
Film distribution arrangements split theater receipts in a front loaded ratio in favor of the studio. For instance, for the first two weeks after the release, the studio keeps a higher share of theater ticket sales. After the first two weeks and every week after that the theater gets a higher percentage of revenues that rises every week the film stays on the screen.
In Disney’s case, we assume that receipts in Disney’s favor average out between 50% to 55%. The actual range varies between 60% – 40% from one market to the next. The expense is classified as theater rentals and becomes line item number 2 – money that actually gets wired back is line item number 3. Roughly half the pie stays with the theaters. Half makes it back to the Studio.
Beyond tickets receipts, other sources of revenues include domestic and foreign home and pay per view, digital, licensing and syndication deals. Depending on the film this line item may generate between 10% – 25% of global box office receipts. We assume a midrange 20% of global box office receipts for marginal and incremental licensing revenues which is line item number 4.
We add it to net receipts after theater rental to get line item number 5, total receipts. As per our model above for the MCU, this figure is estimated at USD 13 billion.
Next up – expenses.
Line items six, seven and eight are estimated production budget, Prints and Advertising (P&A or pre-marketing) and financing costs. Cash rich studios despite having cash in the till may still add a financing charge to the film’s budget. The three together become the largest charge to the bottom line. There is some contention around the right way of charging for film marketing and financing costs. We have sidestepped that debate to keep our analysis simple and easy to understand.
Line items number 10, net proceeds available for distribution is our final number. This is the closest proxy we have to film profits. But the studio still has one more adjustment to make. Talent participation and residuals – the backend pay that made Robert Downey Jr and Cameron Diaz net worth skyrocket on account of participation in net proceeds. We don’t have a number for the MCU but we can plug in a convenient percentage for line item number 11. The actual figure may vary.
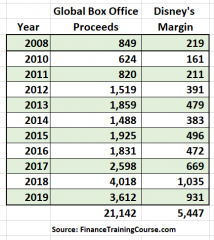
To summarize – from total global receipts of USD 21 billion (line item number 12) Disney is left with USD 5.4 billion. A margin roughly around 26%. Remember that this 26% is distributed across 10 years. From the MCU release dates, the summarized table and our estimated margin in terms of box office receipts above we get our next data point. The annualized contribution by the MCU to Disney’s bottom line. The 2008 figure includes receipts for Iron Man.
Before you feel sorry for Bob Iger and his team at Disney, please note that there are three additional revenue sources that we haven’t factored in our model above.
- The first is merchandising. From lunch boxes to books, from t-shirts to toys. Think about two generations of kids and young adults across an eleven-year horizon that Marvel characters have converted into buyers. In 2019 Disney is likely to generate USD 4.8 billion under a financial statement line item called consumer products and interactive media. Only 8% of Disney revenue, 11% of its pre-tax profit but the highest profitability margin across all Disney business lines. Not all of this is generated by Marvel franchise but we would say that Marvel current and future contribution to this business line is significant and material.
- The second is new park rides and attractions themed around heroes introduced by the Marvel franchise. We don’t have the numbers but we know that this is the largest business line Disney carries. New rides not just bring fresh customers; they give existing customers a reason to return to the park.
- The third is product placements. Look at films as large extended commercials. The commercial in this medium doesn’t come during a commercial break. They are embedded within the flow. The best placements are the ones where you are not even aware of the subliminal programming. Aston Martins driven by 007, classic Mustangs, souped-up Civics banged around town by Vin Diesel, Paul Walker and John Wick; heavy Harley bikes for Captain America; Coke, Pepsi, Mountain Dew for lesser know superheroes, pizza consumed by the ton by Ant man and Flash, deodorant for Hulk, leather jackets and peanut butter sandwiches for Black Widow, Cohiba cigars for Tony Stark – you get the drift. Not all of the above are Marvel or Disney characters but the concept remains the same. Use a product for free, charge a fee for including it in a shot, a set or a scene, throw in an implicit endorsement in the script for good measure. What more could an advertiser ask in terms of exposure? While merchandising and parks and rides carry their own line items, product placement fees are hidden deep within the belly of the beast. Material and significant but no public estimates.
Calibrating with Disney’s published financials.
How far off is our analysis from Disney’s published financial statements. Let’s take a look.

We don’t have the full year statement for 2019 at the time of writing of this note but we have guidance and investor research notes that we can use to paint an estimated picture for the year for Disney.
The film business falls under the business line Studio Entertainment. Estimated annual revenues for the full year 2019 for this line are USD 9.196 billion. Estimated annual profitability, USD 2.590 billion and profitability margin (EBIT %) for 2019 at 28.16%. This is the entire universe of Disney scheduled movie releases for 2019. Of which only two belong to the Marvel universe. As per our estimates above a third of the revenue and 40% of the margin in Disney’s bottom line for 2019 will come from Marvel. Remember this is using numbers for Captain Marvel and Endgame in May while both movies are still in theaters. The finally tally for 2019 for both movies is going to be higher. What is more impressive is that the same held true in 2018 and an average of USD 500 million per year was contributed in 2015, 2016 and 2017 by the MCU to Studio Entertainment.
On the margin front, our estimate of 26% for the Marvel movies collection is not that far off from Disney overall profitability figure of 28% under Studio Entertainment. Note that ’18 and ’19 were big years for Disney because of Black Panther, Infinity war, Captain Marvel and Endgame. The four include three of the biggest films in the franchise. Having said that with box office gross close to two billion dollars a year, ’15, ’16 and ’17 weren’t bad years either. Disney has been on a roll with a five year run of hits. Films that have gone above and beyond their production budgets.
How did this all come about? Who or what made it happen? This requires an answer in two parts. First a history of Disney’s acquisitions followed by two CEO’s who shaped the Disney we know starting from 1984.
Disney’s recent acquisitions.
Pixar certainly helped up the game at Disney animation. In the late nineties, Disney animation studios floundered under Michael Eisner after the death of Frank Welles and the departure of Jeffery Katzenberg after an ugly public spat. If you think it wasn’t ugly go watch Shrek the movie and you would appreciate how much money Mr. Katzenberg saved in therapy dollars by using his creative license to portray a different view of the magical kingdom.
Post Katzenberg and prior to Pixar, Disney animation films became flat and one dimensional. They certainly made money but paled when compared to the complexity and sophistication of Pixar films. It took a while for the Pixar spirit to permeate through the kingdom, once it took hold Disney animation became a completely different animal.
Lucas films, unlike Pixar, came with an independent character universe to play with but the Star Wars franchise struggled under the Disney umbrella. Of the four sequel films, Rogue one, specifically, was better than the prequels produced by George Lucas and made money at the box office. So did The Force Awakens and The Last Jedi. Solo lost money for Disney despite using the same origins formula Disney and Fox have tried with their heroes in the past. Together the four films grossed over 4 billion dollars. But they didn’t make as much money as Marvel and between The Last Jedi and Solo managed to royally piss off Star Wars fans and loyalists to the point that Disney is rumored to put future releases on hold.
Using the same film profitability model we have used above we can do a side by side comparison of the two studios. The results are quite interesting. Despite having an established franchise with Star Wars, more marketing dollars, higher production budgets, better box office gross per film compared to MCU, Marvel still beat Star Wars hands down when it comes to film profitability. Part of this could be the time MCU has had to mature and the significantly longer gestation period compared to Star Wars films.
The Lucas films deal was more than Lucas Films. It included Lucas Arts as well as Industrial Light and Magic (ILM) the VFX studio that came with the package. While Disney quickly rolled out 4 films in the Star Wars universe, the visible math isn’t as attractive as Marvel till you add ILM, the synergies that ILM brought to the table and the unrealized potential of rebooting the Raiders of the Lost Ark franchise. There is not a world of difference in terms of timing between the two deals. Disney acquired Lucas Films 3 years after the Marvel acquisition. The difference lies in the fact that Marvel comes to the table with a plan while Lucas Films had been lost at sea for a while.
Ignoring three additional sources of revenues mentioned above and not factored in the financial model, Marvel has clearly been a better deal for Disney so far. On the 3.9 billion Disney paid for Marvel, it has already received and estimated 5.5 billion. Of the 4.05 Disney paid for Lucas Films, only 893 million have been paid back.
Of the four acquisitions, Miramax’s not for children content leveraged Disney’s distribution muscle but not necessarily its kids friendly merchandising and retail arms. It also took Disney away from its core, the family friendly entertainment business, which is one of the reasons why Disney sold Miramax in 2010 after running it for 17 years.
Compared to the other acquisitions in the Disney mix, Marvel played its cards with precision and choreography that is applaudable. Every single release added value to the brand and the franchise. It did so because of careful planning and execution. I am not a hardcore comic and graphic novel fan but I consider myself well informed about superheroes. I may have never gone out and seen Captain Marvel the movie if it came out as a standalone feature. Marvel played all of us like a fiddle by adding that little end credit scene in Infinity war and releasing Captain Marvel a month before Endgame. Perhaps it is because by the time Disney came around to acquiring Marvel it had already learnt useful lessons from its experiments with ABC/Capital Studios, Miramax and Pixar. It’s a pity the same lessons didn’t work well for Lucas Films.
To be continued…
Notes:
- Boxoffice gross figures from Boxofficemojo.com as at 17th May 2019. I will update figures and tables again post June.
- For ease of comparison Marvel MCU film figures include receipts from Iron man (1) which was originally released by Marvel Studios before the Disney acquisition.
- Film model accounting results are estimates not based on actual results or disclosures
Sources and references.
- We call it Martian accounting, The Guardian, Aug 2001, https://www.theguardian.com/film/2001/aug/31/artsfeatures
- Eisner steps off Disney rollercoaster, The Guardian, Sep 2004, https://www.theguardian.com/media/2004/sep/11/citynews.business
- https://filmmakeriq.com/2009/10/film-contracts-what-are-points/
- Disney reanimated: How Eisner brought the magic back, Andreas Riquier, Investors.com, April 2014, https://www.investors.com/news/walt-disney-animation-stock-revived-in-1980s-1990s-under-eisner/
- Avengers bulking up https://adage.com/article/media/avengers-bulking-6-billion-marvel-licensing-machine/234572
- The Walt Disney Company, Credit Suise, Research Note, July 2018 https://research-doc.credit-suisse.com/docView?language=ENG&format=PDF&sourceid=em&document_id=1080565241&serialid=iA6%2FPHNvzWfNYlVFT3eC2akQ%2BKFXc0kMHQEpwnL6WvM%3D&cspId=1766815890763440128
- https://www.vulture.com/2018/02/why-do-star-wars-fans-want-the-new-han-solo-movie-to-flop.html
- https://qz.com/1496611/disneys-biggest-year-in-movies-yet-could-be-2019/
- Bob Iger rebuilt the magic kingdom, Forbes.com, May 2019, https://www.forbes.com/sites/maddieberg/2019/05/02/bob-iger-rebuilt-the-magic-kingdomand-its-likely-made-him-richer-than-a-disney-heir/#62f163378c9e
- Bob Iger deserves his $66 million dollar compensation, Fortune, May 2019, http://fortune.com/2019/05/04/bob-iger-abigail-disney-stock/
- Avengers: Endgame gross update
- https://www.forbes.com/sites/scottmendelson/2019/05/11/box-office-avengers-endgame-infinity-war-black-panther-long-shot-uglydolls-intruder-pikachu-captain-marvel-shazam/#65c228b450a3