Here is a quick summary of key lessons from the Financial Modeling workshop for startups and founders run by Jawwad Farid in the first week of June.
Lesson One. Thinking Tools.
Models are thinking tools and thought experiments. They may not give you straight answers, right at the start, but they should get you started on the path to one. We build models to help refine business strategies, approaches, and design. Excel is also orders of magnitude cheaper and faster than real life.
All models are wrong, but some models are more useful than others.
How should one build models? Focus on quick and crude results. Your first model is going to be wrong. And that is okay. Use that first run to refine your thinking and your model.
Spending time to add complexity in the beginning will yield diminishing results. Adding complexity on the first pass will blur the line between mistakes and missteps. Mistakes here mean incorrect assumptions or using wrong drivers. Things that need to be fixed before you try and use the model. Mistakes are harder to spot in overly complicated models. Missteps are simple tweaks that get ironed out over subsequent iterations. Your goal on the first iteration is to reach a baseline implementation, not to answer every question you might have. Simple baseline models are easy to troubleshoot and dissect when the results are way off the mark.
Our Financial Modeling course follows the same philosophy. We start with Maya’s Closet, a relatively simple eCommerce business whose models are quick to build, and easy to trace. The models are built to answer simple questions. How do we estimate growth in the middle of a pandemic? How much should we order given supply chain disruptions and the expected drop in demand? Should we go ahead and borrow money?
Lesson Two. Focus on questions, not exact answers.
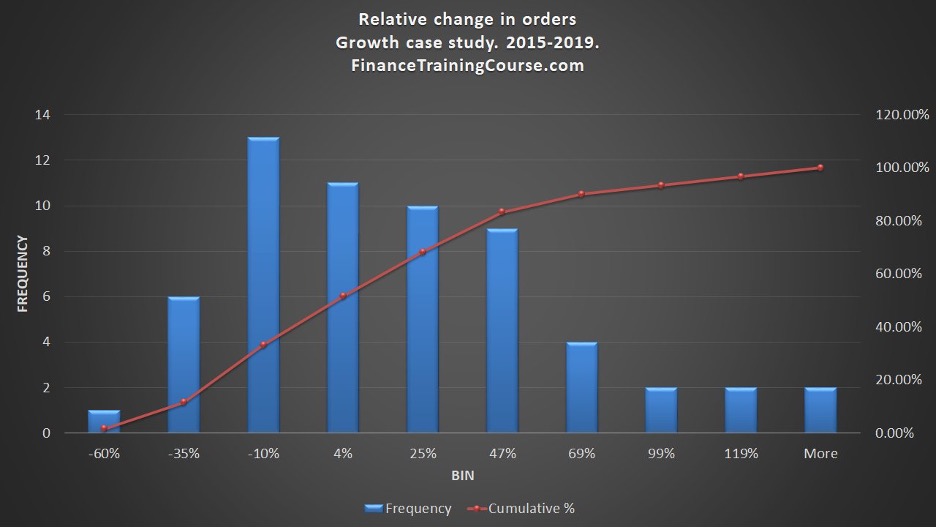
The most important thing to realize is that models based on real data, despite volatile markets and changing conditions, with basic assumptions and a qualified design can give powerful insights. In the case of Maya, we built a simple model using monthly order history from pre-pandemic years which did not account for seasonality or a global lockdown.
The question we needed this model to answer was: what is the probability of having one, two, or three consecutive months where orders decrease from the previous month. The answers came out to be in the range of 10%, 1%, and 0.1% respectively. The exact answers did not matter, but the trend and insight did. What was the insight? The probability of seeing three down months in a row was quite low. While there would be short term pain, Maya needed to be prepared for the post lock down upswing in orders.
Using the right lens to interpret data is as important as using the right methods to extract information from it. For example, while the short term outlook for Maya was terrible, their model indicated that they needed more inventory for the year, even if monthly orders for March dipped.
The market for children’s clothes may dip, but it can’t dry up. 17 million households need to be fed, need clothes to wear, need to continue living. And so do the children in those households. Inertia and momentum are wonderful things for a model.
Lesson Three. Adding complexity
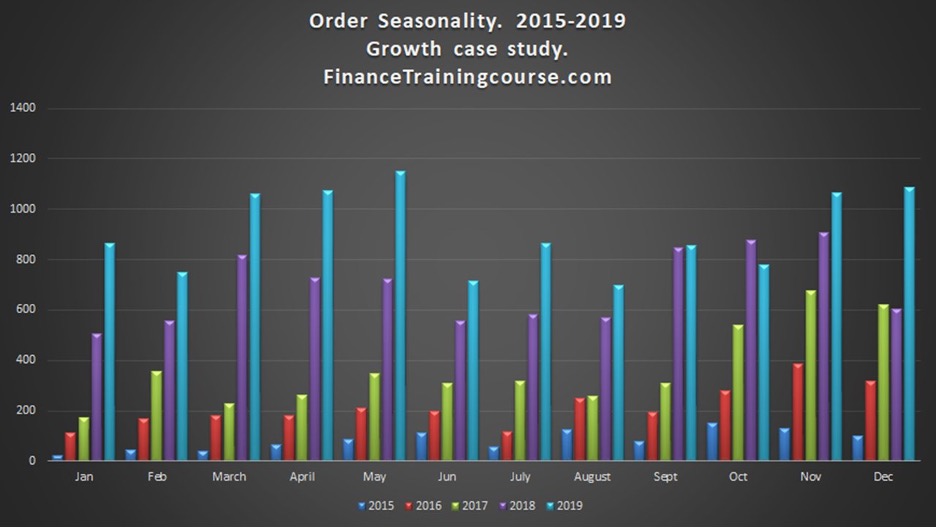
As we spoke of before, mistakes are easy to identify in simpler models. Once we realized that our growth forecast did not incorporate seasonality or the pandemic, we quickly corrected course to address both issues.
Seasonality can be incorporated in several ways. We were forecasting March sales, and could proceed with:
- Historical March sales as a percentage of yearly sales
- Historical Q1 sales as a percentage of yearly sales
- Historical percentage change from February to March
- A more complex modeling approach or design would refactor data into seasons and estimate the change between seasons.
Moving on to revenue forecasting. For eCommerce stores, a simple model for revenue forecasting is the sales funnel.
Impressions >> Click through rates (CTR)> > Clicks> > Conversions (CR) >> Orders> > Ticket Size> > Revenues.
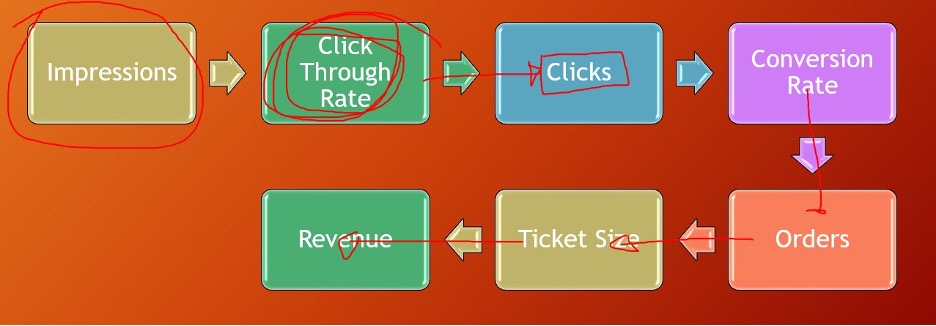
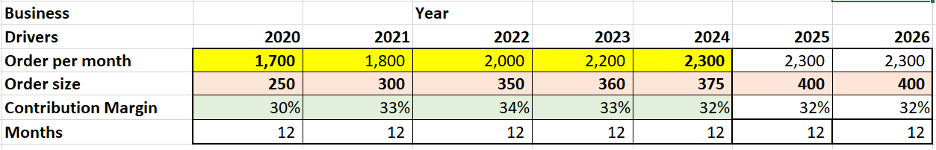
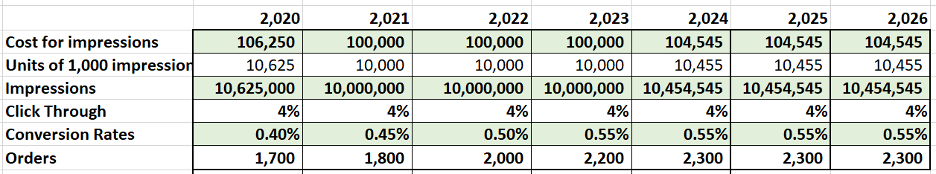
This approach lets us work backward to see what targets we need to hit, and how much we need to budget. For example, to estimate annual marketing spend for a target of 1700 orders,
- How many impressions do you need if historically you have had an average 4% CTR, and a 0.2% conversion rate?
- If the cost-per-mille (CPM) is $4, what is your monthly ad spend?
Lesson Four. Dynamic Models. Data Tables. Scenarios.
The full potential of scenario analysis like the one above is unlocked by building dynamic models. Dynamic models automatically update based on changes made to one input, allowing us to follow the trickle-down effects of those input variables. They also allow us to go in reverse. For example, we could calculate how many orders we get from a certain amount of ad expenditure, or calculate how much ad spend we need based on target orders.
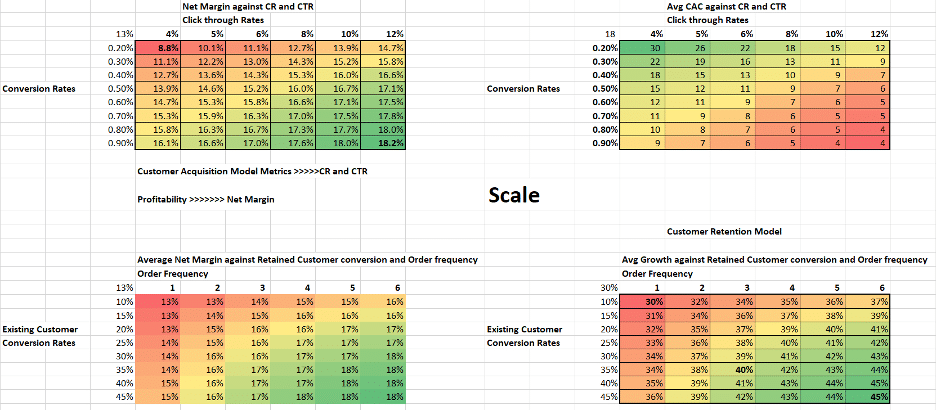
Linking dynamic models to data tables further amplify our models’ utility. You can test the effect of two variables against one metric. For instance, to compare scaling strategies, we looked at
- Conversion and click through rates against Net Margin (profitability).
- Customer retention and order frequency against average growth
Data tables linked to the dynamic model quickly calculated 96 possible outcomes from input combinations. This is only possible with dynamic models.
Unfortunately, dynamic models quickly become unwieldly, and a better way to build them is to build simpler sub-models.
In Maya’s case, build sub-models for ad spend, conversion, customer retention, order processing costs, head count and admin expenses. Feed these results into your main model. Now, when you want to tweak ad spend, you need to only look at that sub-model and not get lost, instead of a 200-line monster with dozens of columns.
Remember, you always need a statement of cash flows or at the least an estimate of free cash or change in operating cash from one year to the next. Always. Without one, cash, retained earnings, and net assets will all be out of alignment and your balance sheet will not balance.
Finally, you want to make sure you find good drivers to model your business. Your model is only as good as the drivers and relationships that constitute its inner workings. You find good drivers by knowing exactly which questions you want to ask. And which factors influence the answers to those questions. Incorporate those drivers. And then build, test, and repeat.
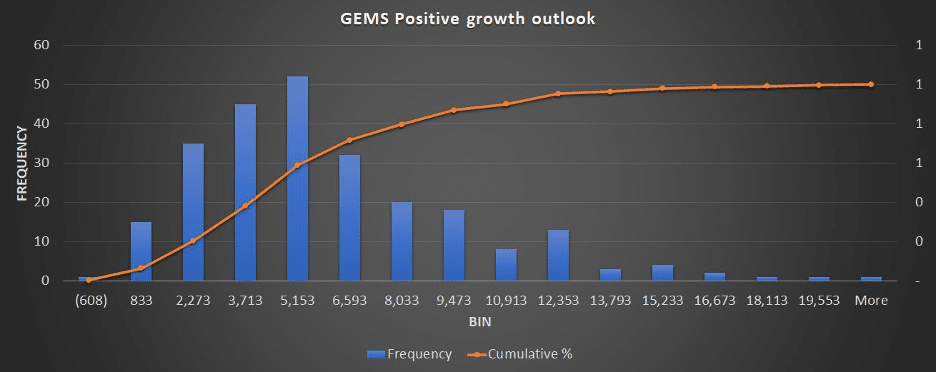
Lesson Five. Advanced Topics. Simulations.
There is a branch of modelling concerned with forecasting called simulations. When simulating trends, prices cannot be easily determined due to the intervention of random variables. In these scenarios, a Monte Carlo simulation is a powerful tool to understand the possible outcomes and their associated probabilities. This range of values allows us to extend models to forecast for scenarios and variables for which adequate historical data may not be present.
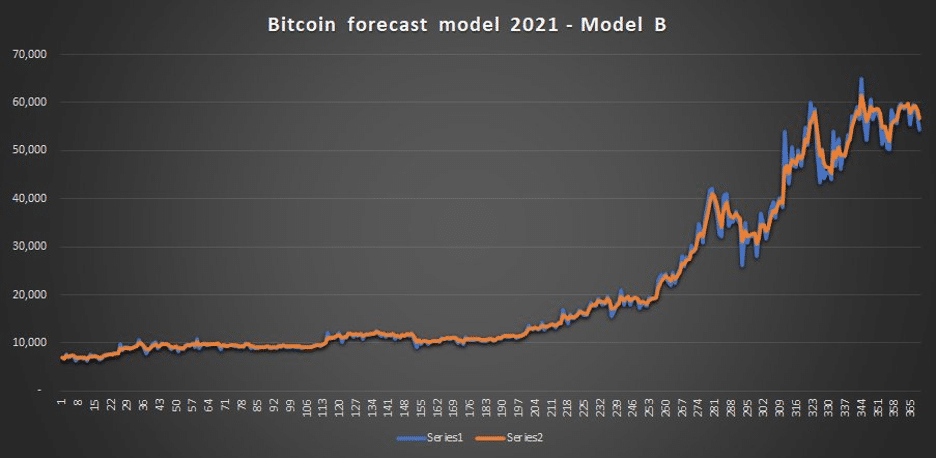
When running simulations, it’s necessary to not trust models blindly. Between the two shown below, which one would you pick? (Hint: this may or may not be a trick question).
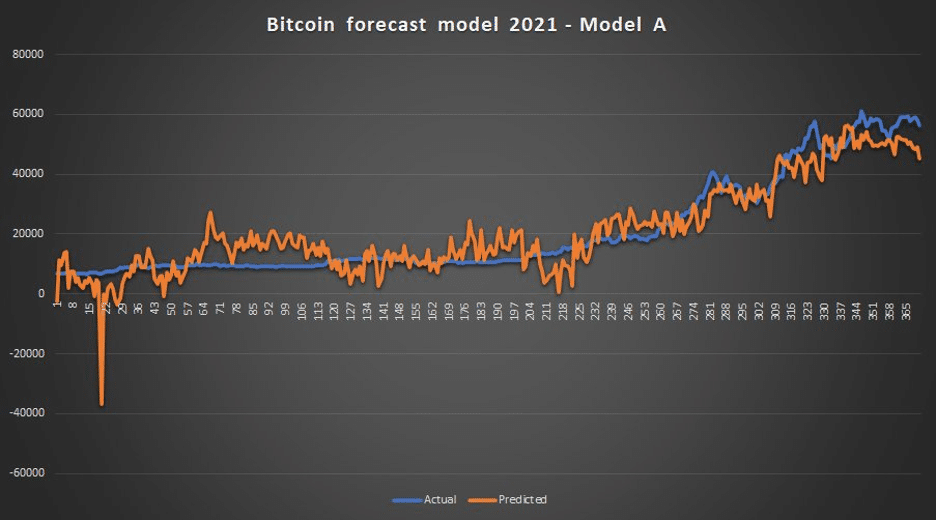
Finally, models can and should also be used to temper expectations. Those not-bloody-likely scenarios that good practitioners of financial modelling must be comfortable in identifying, calling out and painting.