How to build an RSU expense simulation model in EXCEL for stock settled RSUs which are dependent on market conditions.
1. What is an RSU?
Restricted Stock Unit grants have increasingly become a feature in companies’ long term incentive equity compensation programs. A company discloses RSU expense in its financial statements from the grant date to the vesting date. The treatment for RSU expense differs if the contract is settled in stock or cash. If the contract depends on market conditions, RSU expense calculation uses a simulation model to estimate likelihoods of meeting these conditions. This post will focus on the calculation of RSU expense for stock settled RSUs dependent on a market condition.
RSUs give the grantee the contractual right to receive a specified number of shares (stock settled), or a cash payment of equal value (cash settled), in the future. While RSUs do not have voting rights, dividends equivalents may also accrue. RSUs are a promise that the issuer will make a payment based on meeting vesting conditions and restrictions on transferability. The intended compensation remains unfunded.
Vesting conditions may be based on service (time vested) or performance/ non-market (e.g., EPS or ROE) or market conditions (e.g., volume weighted stock price threshold). Time vested conditions may be
- cliff based where the total award vests after a specified number of years of service, or
- subject to a grading schedule where a certain proportion of the award vests each period, or
- time accelerated based on certain events occurring prior to the vesting date or change of control. Events include death, disability or the achievement of a performance or market condition.
IFRS 2 & Fair values
According to IFRS 2, the fair value of RSUs settled in shares is based on the stock price on the grant date. Then, the value is expensed over the service period on a proportionate basis. The fair value considers forfeitures and the expected number shares that will vest. This is based on employees completing service requirements and the likelihoods of meeting performance and market conditions.
RSUs settled in cash have a fair value based on the stock price on the date of determination. Then, this value is expensed over the remaining service period less any amounts previously recognized.
The fair values of RSUs dependent on satisfying a market condition are usually determined using a Monte Carlo simulation.
Valuation & RSU expense – Company versus employee view
In this post the valuation calculation is from the company’s point of view. This view assesses RSU expense to disclose for accounting purposes. The employee has a different lens in terms of valuation. For an employee an RSU’s value depends on:
- The future stock price on the date of vesting
- The time remaining till vesting date
- The probability of satisfying vesting conditions
- The risk-free rate use to discount the future value of the RSU to account for the time value of money
- The income tax rate of the employee
The difference mainly lies in the price used to value the RSU. For the company determining expected RUS expense, it is based on the price at grant date. Grant date price is adjusted for vesting conditions and termination or survival rates. For the employee, the value is based on the expected future price on the vesting date. Expected future price is adjusted for vesting conditions, termination or survival rates, taxation and discounted for time value of money.
2. Sample RSU vesting conditions
Let us assume that Yelp Inc. grants 10 of their executives 150,000 stock settled RSUs each on June 30th, 2021. Each RSU unit represents 1 share of YELP stock. The RSU is based on the following vesting conditions:
- The employee remains continuously employed on the third anniversary of the date of grant
- One-half of the award triggers when the company’s stock price trades above $50 per share on a 20-day volume weighted average (VWAP) price.
- One-half of the award triggers when the company’s stock price trades above $60 per share on a 20-day volume weighted average (VWAP) price.
- Accelerated vesting on termination from certain specified events, including death and disability, is also offered. For each full year of service on termination, one-third of the total RSUs granted will vest. For the illustration, we assume that the withdrawal rate is 3% per annum. We assume that withdrawals are occur at the end of the year. Also, we assume that terminations only occur for events that trigger accelerated vesting.
We are valuing the option as of August 30, 2021.
3. Steps to model stock settled RSU expense where vesting is based on market conditions
Simulating future stock prices
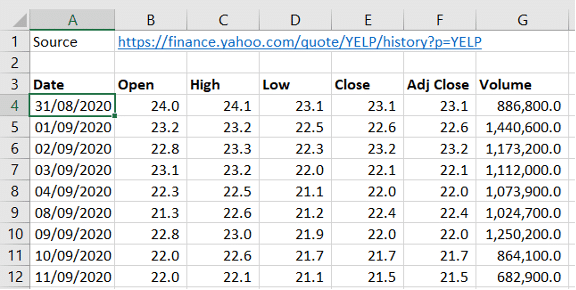
Step one: In the first stage of building the RSU expense model we obtain the historical share price series of the company whose RSUs we are valuing. So, we have downloaded YELP’s daily share prices for August 31, 2020, to August 30, 2021 from Yahoo Finance.
Our focus will be on the columns Adj Close & Trading Volume. We use the Adj Close series instead of the Close series because it reflects dividends and splits while Close only adjusts for splits.
Step two: Next, we calculate the daily volatility and annualized volatility using the return series for Adj Close & Trading volume. We use the entire one-year data series to determine the daily volatility. However, you may choose a more recent window of returns, like the last three months before the valuation date.
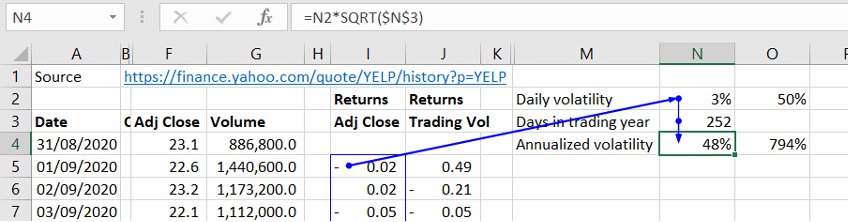
Step three: Then, we determine the number of days remaining between the vesting date and the valuation date. This works out to 715 days for our example. Our time interval/ length of interval for the valuation model is daily, i.e., 1/252 days. Therefore, we need to simulate daily prices till the vesting date.
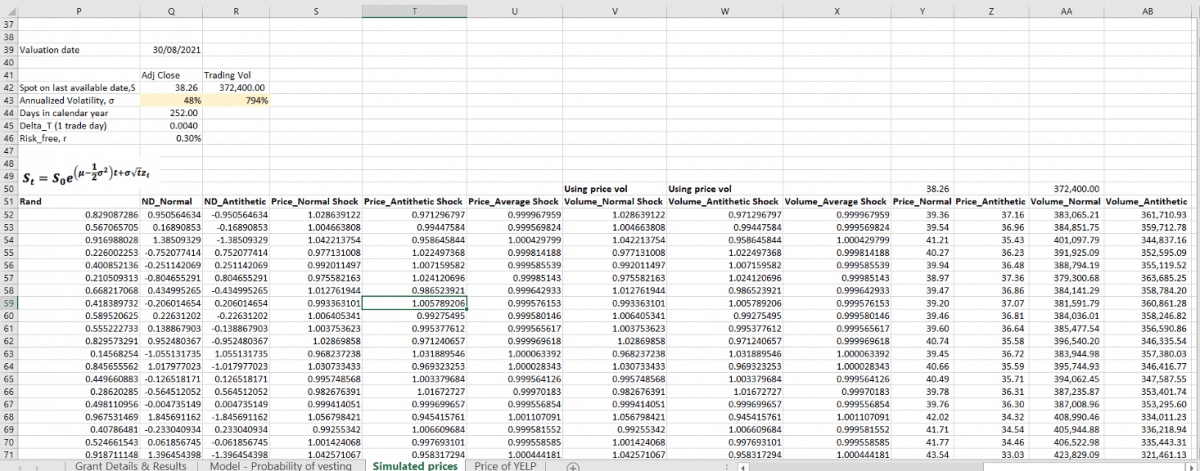
Step four: Next, we simulate the daily Adj Close & Trading Volume for the number of days determined in step two. We do this for both simulated normal and antithetic series. Calculate the simulated price series with the Black Scholes Merton Terminal price formula St=S0e(μ-1/2σ2)t+σ√tZt. For a refresher on how to simulate share prices using a Monte Carlo simulation model, click here. To review how to improve the accuracy of your MC model using the antithetic variable technique click here.
Note: For Trading volume we use the volatility determined for the price return series because the volume series using trading volume volatility is converging to zero at later days.
Market condition – Volume Weighted Average Price
Step five: Next, we factor the market condition in the RSU expense model. In this step we calculate the series of 20-day volume weighted average price, VWAP. We do this separately for the normal and the antithetic simulated price series. Actual prices are used where available.
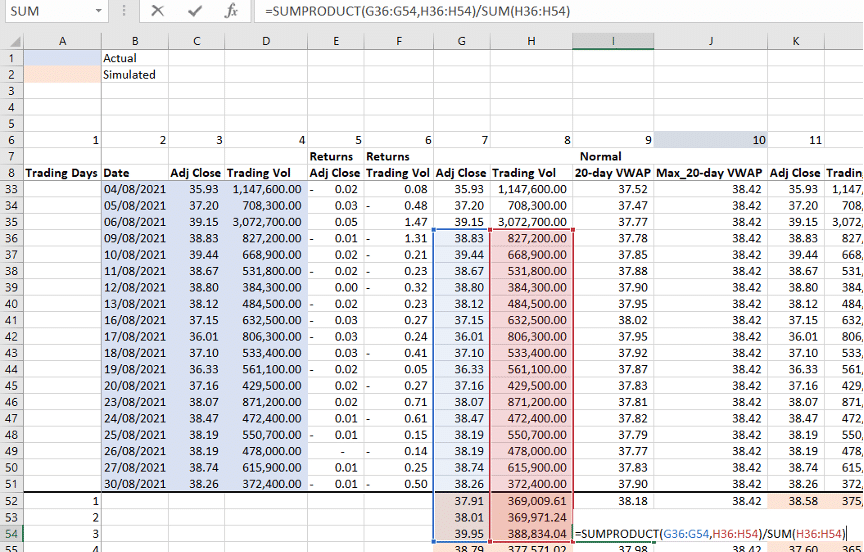
We determine the volume weighted average price in EXCEL. Divide the SUMPRODUCT () function using the Adj Close and Trading Vol series with the SUM () function using Trading Vol series.
Step six: Next, we calculate a maximum VWAP series for each of these streams. This ensures that if the market condition is reached, it remains triggered from that day onwards.
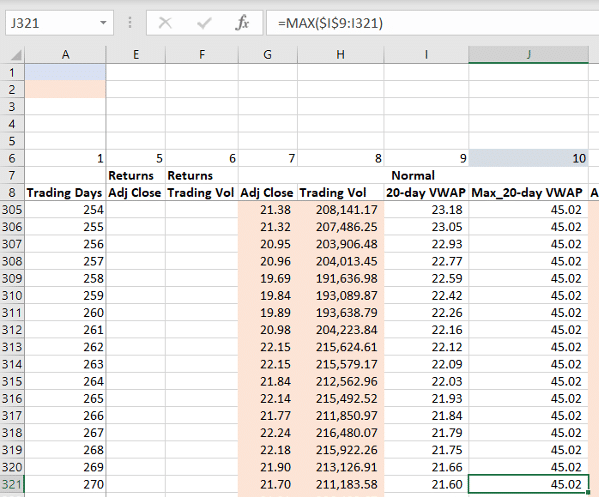
Max_20-day VWAP (column J) gives the maximum value from 20-day VWAP (column I) up to that given trading day.
Build a model to assess the likelihood of meeting market conditions
Step seven: The RSU expense model flags or records triggering the market condition. In this step we determine meeting vesting conditions for end of years 1, 2 and 3 respectively and on the vesting date. We do this for both the normal and antithetic scenarios. Hence, for each condition, and in each year the following sub-steps will apply:
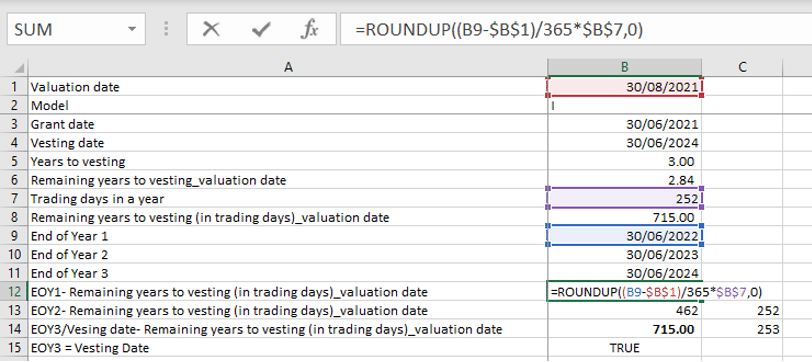
- Calculate the number of days from valuation date to year end. The screen shot below shows the number of days to year end 1:
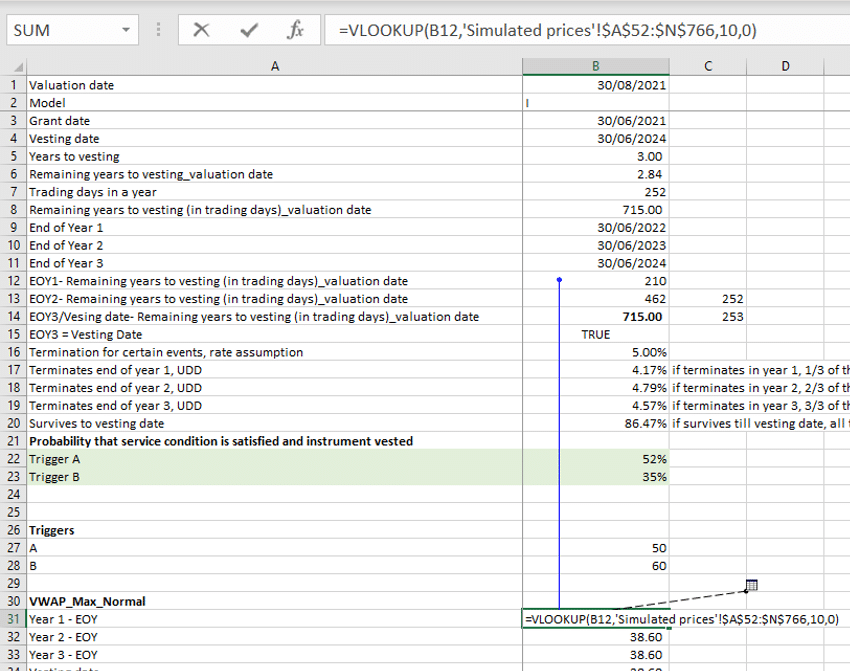
- Use EXCEL’s VLOOKUP () function to pick the maximum VWAP for the remaining number of days till the year end anniversaries. Do this for both the normal & antithetic scenarios:
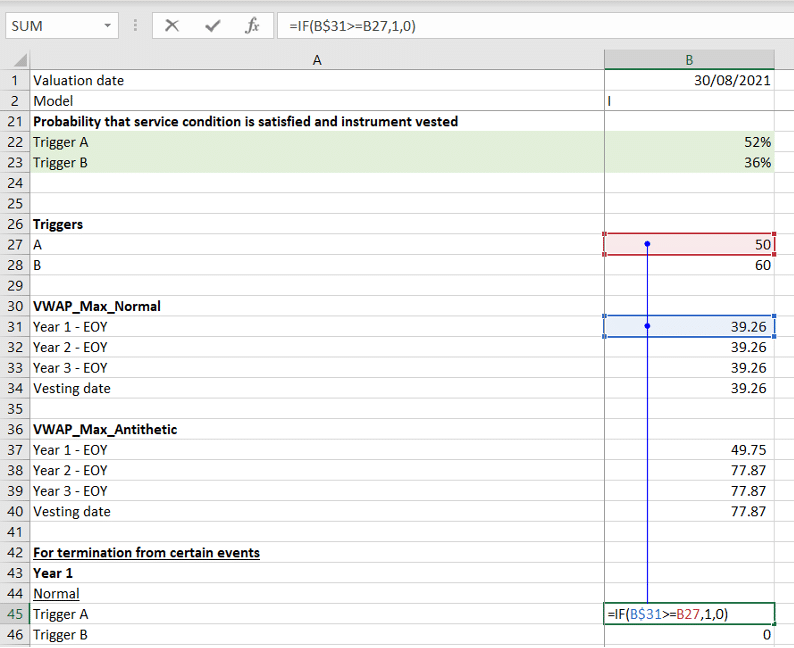
- Assess triggering the RSU market conditions. So, if the maximum 20-day VWAP at the number of days (based on yearly anniversary) is greater than or equal to the market condition, record reaching the trigger with a 1. Otherwise, record not touching the trigger with a zero 0.
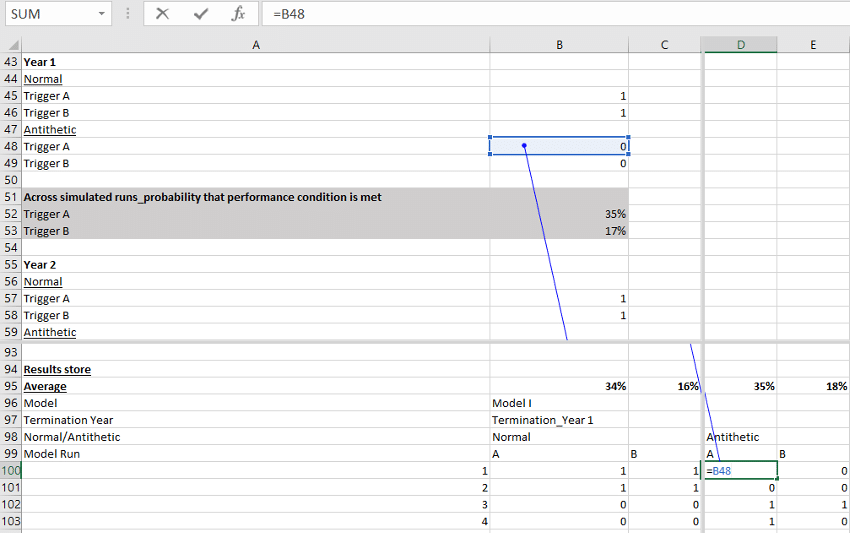
Step eight: Store the results from 2,500 runs of these year-wise normal & antithetic trigger events in a data table:
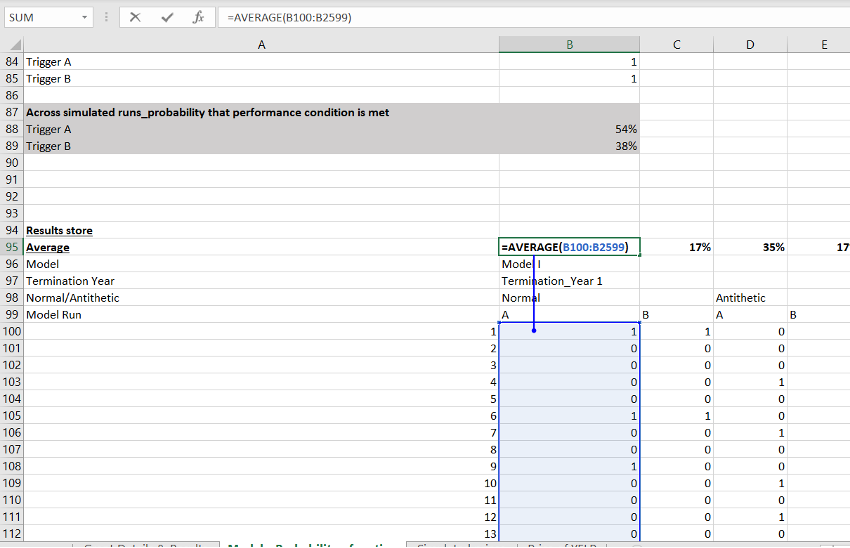
Step nine: Calculate averages of the triggers across all runs
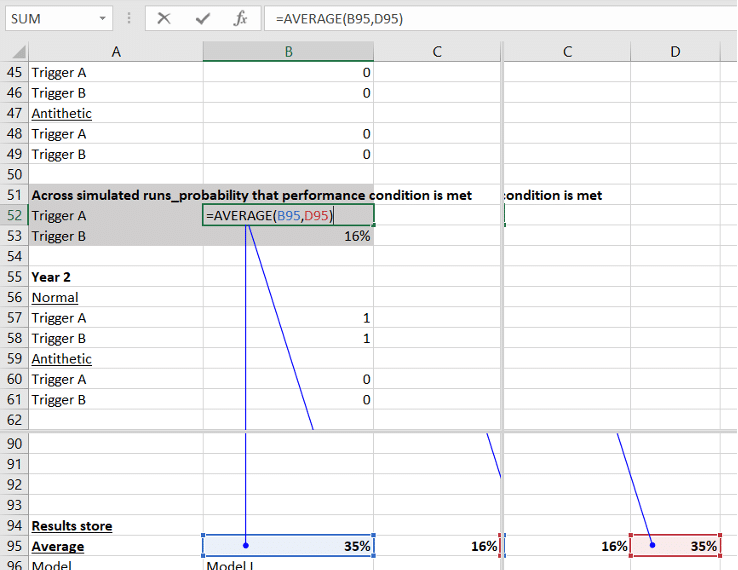
Step ten: Calculate the average of normal and antithetic averages for each trigger in each period
Determine probabilities of termination & survival
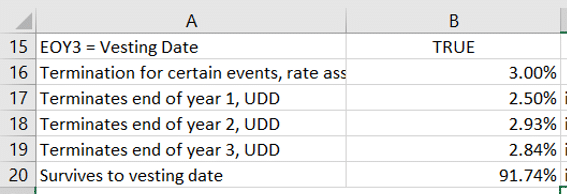
Step eleven: Besides recording the market condition trigger events, the RSU expense model factors in forfeitures. In this step we calculate the probability of termination in each successive period and the probability of survival to the vesting date. As mentioned earlier we use an annual termination rate of 3% p.a. We also assume a uniform distribution of decrements to account for the fact that the periods may not be for a full year. This means that 0.5qx = 0.5qx where qx is the annual termination rate. Calculate the cumulative termination rates at the end of each successive year as follows:
- q1 = End of Year 1 termination rate = 0.03 x 210/252
- End of Year 2 termination rate = (1 – q1) x 0.03 x (462-210)/252
- End of year 3 termination rate = (1- q1) x (1-0.03 x (462-210)/252) x 0.05 x min {(715-462),252}/252
- Survival to vesting date = (1 – q1) x (1-0.03 x (462-210)/252) x (1 – 0.03 x min {(715-462),252}/252)
Probability for each trigger considering termination/ vesting
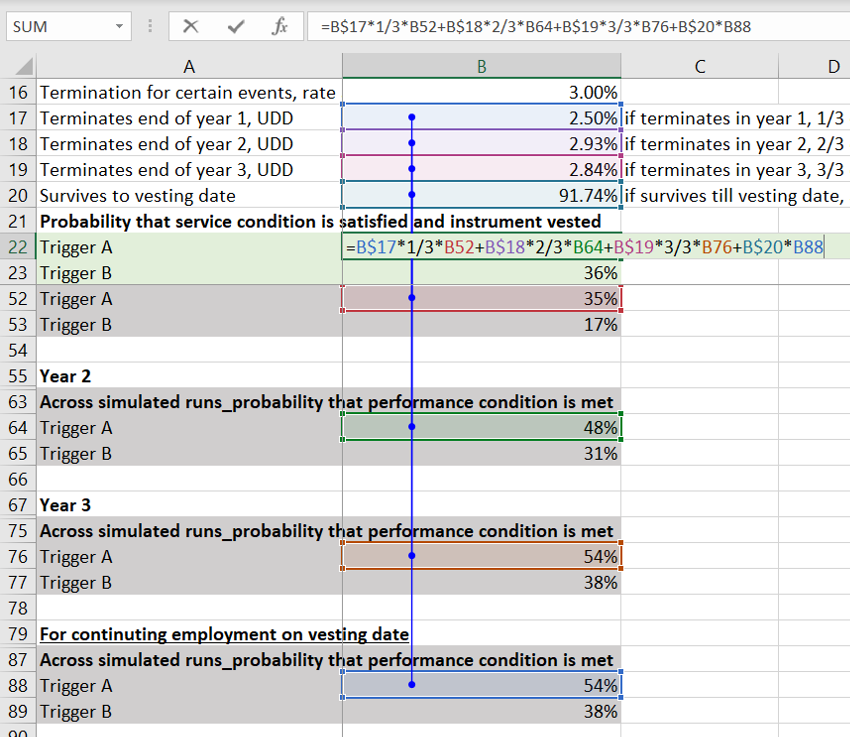
Step twelve: Next, we calculate the probabilities of satisfying the market conditions, and termination or vesting for each trigger. For termination before vesting, we use a reduced fraction of RSU, 1/3 for each completed year.
Expected cost of RSU (RSU expense)
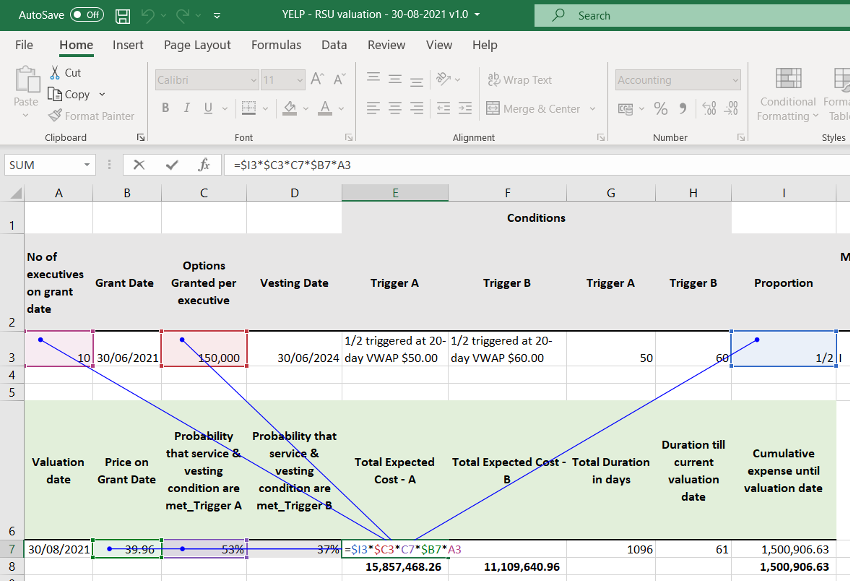
Step thirteen: Apply the calculated probabilities to the RSUs granted for each market condition times the market price of the stock on grant date to determine total expected cost for that trigger. The quantity of RSUs granted for each trigger equals one half the RSU for each executive times the number of executives.
Step fourteen: Finally, calculate the cumulative cost by prorating this total expected cost for the number of days from grant date till valuation date. Cumulative cost = Total Expected Cost x (Valuation date – Grant date) divided by (Vesting date – Grant date). This is the RSU expense till the valuation date.
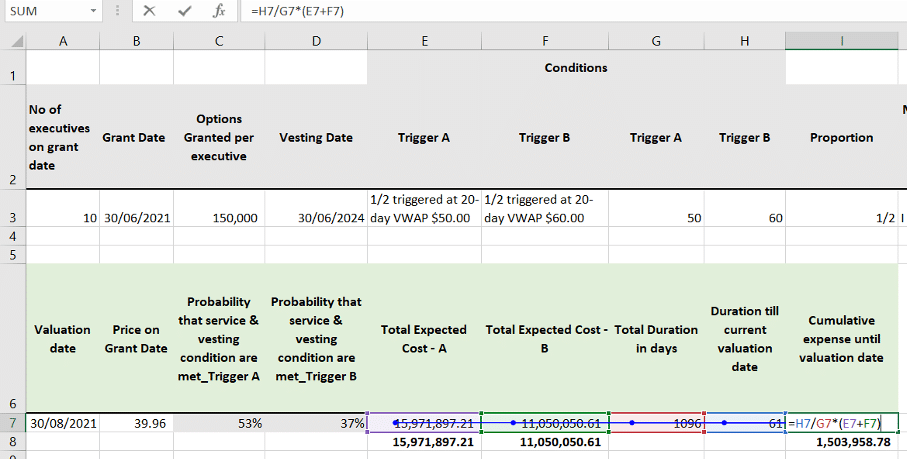
Note: The cost (RSU expense) for the current valuation period is the cumulative cost as at the current valuation date less the cumulative costs for the prior valuation dates.
4. References
- Share Based Payments IFRS 2 Handbook, KPMG November 2018 (see example 6.2.3)
- Equity Compensation and the Rise of Restricted Stock Units, Joshua A. Agen, June 2018, Foley & Lardner LLP
- Restricted Stock Unit Fundamentals, Meridian Compensation Partners, LLC, December 2015
- Valuing Restricted Stock Market Units, November 2020
- Valuing RSU’s, Edgar Wang, June 2019