How big is Pakistan retail trade sector and at what rate is it growing? 4 engagements in 4 weeks and we have come back to this question multiple times. Each time we have looked at it from a different lens and seen similar answers to our queries.
The most common answer to this question is $57.6 billion, a 2020-2021 estimate. If you have reviewed a grocery, quick commerce, dark store, hyper-local, logistics, cash on delivery, or online e-commerce pitch deck you may have already seen some variation of this figure.
What is the source for this estimate? How does it break down by sub-segments? Is it a reasonable and accurate estimate? Can we validate it? Is it based on a calendar year or fiscal year? Does it make sense? What has this got to do with lazy data?
One of my personal pet peeves is lazy data. The tendency to take data at face value and use it without doing diligence on it. If you have seen the
$57 billion figure and haven’t asked the questions above, you suffer from Lazy Data Syndrome (LDS). Data that you don’t own, source, understand, validate, or should be using, but still do.
In courses I teach at the graduate, undergraduate, and founder levels, using lazy data is a cardinal sin. As a founder, your plans are as good as your data sources. Bad data leads to flawed plans and sub-par execution.
The short checklist below can help avoid LDS at work:
- u003cliu003eIdentify and use multiple, not single, sources that can help you validate assumptions.u003c/liu003eu003cliu003eRely on primary sources rather than secondary sources. Good secondary sources will list primary sources. Check the original cited source to understand how data was gathered and modeled.u003c/liu003eu003cliu003eAsk questions that challenge implied assumptions within the dataset. Qualify opinions and insights. Diligence and peer review both.u003c/liu003eu003cliu003eIdentify relevant metrics that help validate or model assumptions.u003c/liu003eu003cliu003eTrack and test the core thesis behind your idea over multiple years.u003c/liu003e
As a founder, never take anything, let alone data, at face value. If you can’t cite primary sources or verify the numbers you are using, you have an issue. Bad data is a contaminant that corrodes credibility, infects analysis and shortstops presentations. If you can’t trust the data set, you can’t trust the presentation or the founders behind them. If you are seeing lazy data now, you are likely to see lazy thinking later.
I see lazy data and challenge it whenever I can. The $57.6 billion number was a quick trigger. Can we clean up and validate the $57.6 billion estimate, break it down into sub-segments and run it through filters to see how it holds up?
Why Pakistan’s retail market?
Why is this an important number and what does it include? By a broad definition of retail, retail covers everything sold under or through what we typically view as a shop or store. It is the total addressable market (TAM) number everyone looks at and uses when they are trying to assess the size of the opportunity in their space.
The question is what part of this opportunity is relevant to your plans?
Sizing Pakistan’s retail and wholesale segment
Inspiration for this rant is a recent market sizing exercise. Our conversation started when we challenged the $57.6 figure and its origins.
A second inspiration was a question by Dr. Irfan Ahmed on ecommerce market sizing and its share with respect to the overall retail market in Pakistan. Dr. Irfan’s comments were of interest because of the comparisons he drew with more developed markets. Other commentators also indicated similar challenges when we compared consumptions trends with middle-class growth and documented GDP figures for Pakistan. Both Dr. Irfan and other commentators posed a simple yet interesting question: What would serve as a valid upper bound on future market size? Great questions that deserve worthy answers.
Let’s start with a simple statement.
The retail and trade segment and its growth rate serve as an overall cap on any ecommerce related projections.
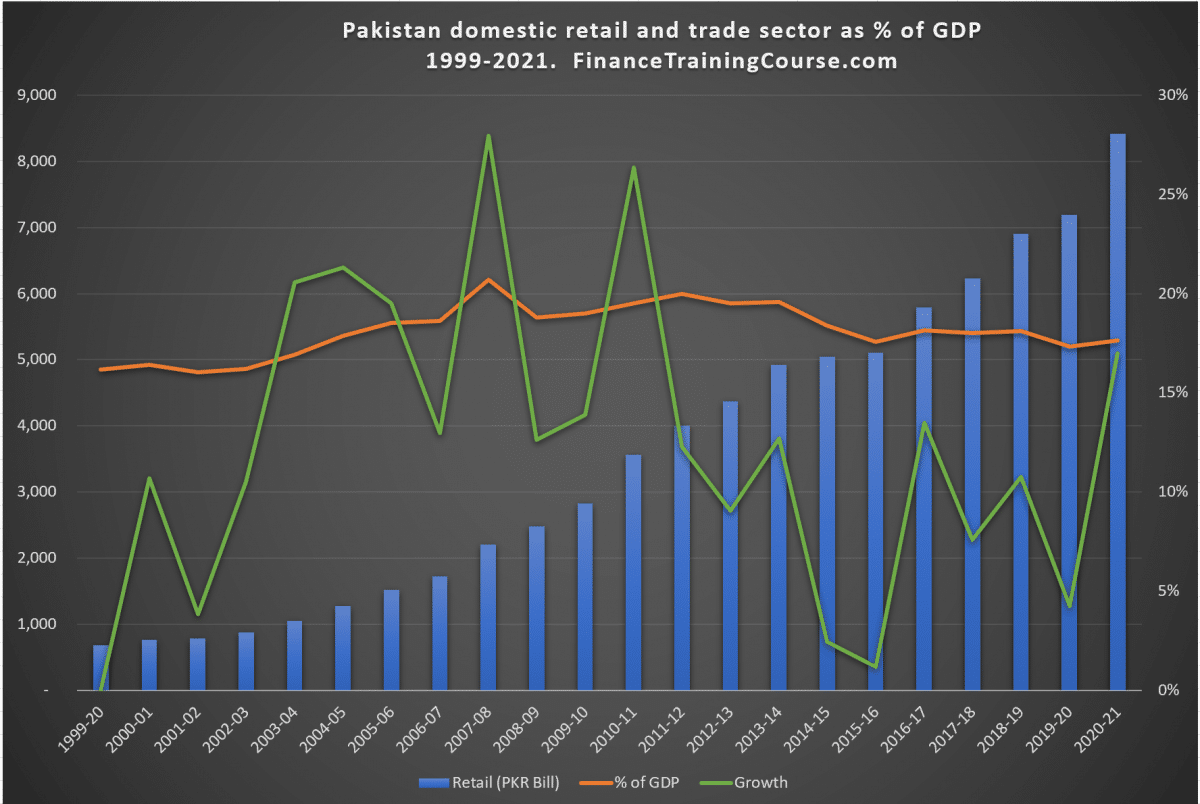
While retail as a percentage of GDP has hovered between 15% – 20% across this period (orange line), the growth rate (green line) has fluctuated wildly. Despite the fluctuations, retail contribution to the GDP hasn’t seen a year of negative growth. On a nominal basis retail has grown at a cumulative aggregate growth rate of 12%, while the underlying population and real growth has been in the low single digits. The difference is inflation at work and hence the absence of negative growth in nominal figures.
While we may want to, it is unlikely that total ecommerce throughput in Pakistan will grow beyond 100% of the retail and trade segment. It may grow at a faster clip compared to brick-and-mortar stores, but it will always remain a fraction of the overall market size.
If the overall market size is $50 billion give or take a few, growing at 5% – 10% a year, year on year, how big is the market likely to be 5 years down the road? The answer is somewhere between $63 – $84 billion. If through an act of God retail in Pakistan goes completely digital, this becomes your GMV estimate with 100% market share.
If your 5-year projected ecommerce GMV volume is showing $40, $50, $60, or $80 billion for 2027-28 year-end, you need help. Ideally, change your medication, your therapist, and the team you are using for building your financial models.
Closer to planet earth you do 20% of retail as ecommerce, which is more likely, your total ecommerce throughput will be between $12 – $18 billion a year.
Lazy data valuations
As a payment play focused on enabling digital payment transactions for ecommerce purchases, your projected throughput 5 years down the road shouldn’t be higher than this figure. If your share of the merchant discount rate (MDR) pie is 1%, and you own the entire pie, your topline revenue is likely to be in the $120 million to $180 million range.
Split the pie 4 – 8 ways and none of the ecommerce payments-focused startups or for that matter grocery delivery teams are going to end up as unicorns. A $20 – $30 million dollar topline will not justify billion-dollar valuations for frontier market startups if they continue to focus on just retail and trade.
You can apply the same thinking to every other idea and team in related spaces and reach the same conclusions. Once you have the size locked down you can apply a gross margin percentage to estimated top-line revenues and then a price to sales multiple to get to a valuation range. For instance, with weighted average gross margins running at 2% – 5% for ecommerce retail, cumulative industry top lines may range from a low of $200 million to a high of $900 million. Split that across ten to fifteen well-run survivors and apply real market-based multiples that work for you. And by the market base, we mean the relevant local market, not NASDAQ because that certainly does not apply to you.
There you go that is lazy thinking for you. We wrote off an entire movement and community of founders without doing any real work. We made assumptions, put them together, ran back-of-the-envelope calculations, and we are done.
If you had the $57.6 billion number in your deck and were happy with it, you should also be happy with the above analysis.
The importance of data sources
The analysis above is based on four crucial assumptions.
- u003cliu003eHow big is the retail and trade segment in Pakistan today?u003c/liu003eu003cliu003eAt what rate is it growing?u003c/liu003eu003cliu003eWhat portion of this will ultimately be processed online?u003c/liu003eu003cliu003eWhat part of the online portion will be paid via digital payments?u003c/liu003e
We will try and answer the first two questions on this list today. The first step on that journey is asking for current and potential sources for these numbers. Without diligence, you are likely to trip and fall before our 5-year forecasts are realized.
When you ask someone for a source, the most cited sources are secondary sources from news stories, aid agencies publications, Twitter threads, and consulting decks. Primary data is generally rare.
If a founding team can’t find primary data, there is a reasonable chance, they won’t be able to find paying customers too. It is a selection filter we often use to gauge the seriousness, commitment, and diligence of a team to their idea. Primary data is important because we need to understand how it is collected, any sampling flaws that we need to adjust for, and models used to analyze the data set.
It doesn’t take a lot to track down primary data and yet as a founder, it is a practice you need the discipline to build. There is nothing wrong with citing the right news stories that do cite their traceable, verifiable primary sources but there are issues with citing coverage that does not share sources and methods.
How big is the retail market in Pakistan? A first pass.
Our first model candidate for the $57.6 billion market size source was an estimate for retail and trade as a percentage of Pakistan’s GDP.
If we can find an accurate estimate for the total GDP of Pakistan and then multiply it by the retail and trade segment share, we will have our answer.
As a lazy thinker, our first stop was Wikipedia entry on Pakistan’s Economy which give us a $300 billion estimate. 19% of that estimate gives us $57.6 billion for the total retail and trade segment for Pakistan. Problem solved?
For a first pass, it is not too far off from the actual number. But how accurate is it as an estimate and should you use it? Let us take a quick look.
There are two acceptable sources for Pakistan’s GDP that you can live with.
The easiest to find on a search engine is World Bank’s country profile. You will find two data sets. Constant dollars and current dollars. Since we are looking at local market size as a founder, the number we need is current dollars, not constant dollars. You will be raising funding in 2022 dollars, not in 2015 dollars, hence current dollars.
While the constant dollar figure for the World bank dataset has been over $300 billion for 3 years, the current dollar figure from the most recent World Bank estimates for 2020 is $260 billion. If we take the current dollar figure and multiply it by the same 19% segment size estimate, the market size comes out to be $49.9 billion. This becomes candidate A.
By the way, since we are on topic, the 22-year average retail segment percentage of GDP (2021-1999) is 18.14%. The 10 years average (2021 – 2011) is 18.43%. The most recent year estimate is 17.6%. The 19% estimate used above is flawed.
PBS dataset
The more reliable, recent, local, and primary source is the Pakistan Bureau of Statistics (PBS).
PBS tracks and publishes multiple data sets on a periodic basis. PBS dataset along with the State Bank of Pakistan is the source for the Economic Survey of Pakistan annual report published every year before the budget. There are challenges and biases associated with the data set. But it is the largest publicly available information set on Pakistan. You can also cross-check estimates using other segment-specific data sets within PBS. The big challenge other than implied bias is you get PDF files rather than Excel or CSV downloads.
According to PBS and Economic Survey of Pakistan, Pakistan’s GDP for the fiscal year 2021 (July 2020 to June 2021) stood at PKR 47.7 trillion. The share of the retail and trade segment stood at 17.6% (2020-21 year estimate). Hold these two figures in your head while we go to work.
Using the same average dollar rate used by the Economic Survey of Pakistan for fiscal 2021 (USD: PKR 159.62), and multiplying the 47.7 trillion figure with 17.6%, we get a $52.763 billion estimate for the retail and trade segment. This becomes candidate B.
Both A and B are workable estimates because you know where they came from. B is better than A because it’s more recent, based on a more detailed primary data set with multiple drill-downs. Also, because A is most likely based on B with some adjustments. A 17.6% share will lead to a lower estimate in A.
The PBS figure is for fiscal 2021 (July 2020 to June 2021). The World Bank figure is for the calendar year 2020 (Jan 2020 to Dec 2020). We are not sure if that is the case. You will have to dig through World Bank metadata to find out the exact/actual definition.
I prefer data sets that I can rework from the ground up. I know how to do that with the PBS dataset. As of now, I don’t understand how to do this with World bank data. Not a fault of the dataset just a question of our familiarity with it.
Depending on how you slice it, the error between our original estimate US$ 57.6 billion and candidate A ($49.9 billion) and B ($52.76 billion) ranges between 15% and 9%. Big enough to raise eyebrows depending on how this number is used within your projections. While your projections may be completely off, we expect you to get the initial market size right, at the start.
If the average error in your assumptions and projections in a 3% – 5% gross margin business is between 9% – 15% you need better models or a higher margin business.
The Growth Question?
Our second question deals with growth. At what rate is this market and its share growing on a year-on-year basis.
The growth engine is driven by three parts.
- The first part is overall GDP growth rate. This has generally been in 2% – 5% range across 5 years.
- The second and third parts are inflation and depreciation in USD:PKR exchange rate in favor of US dollar. The combined impact of inflation and PKR depreciation against USD stays in the 10% – 15% range most years. It may be higher or lower in some years, but it averages out.
- A cross check on growth estimate is growth over last decade. This number is 12% per year over 1999-2021.
A large part of retail consumption is linked to imported raw materials and finished products hence imported inflation is a factor. If you are doing your retail projections in US$ term, the nominal increase in rupee value of sales will partially cancel out the impact of USD: PKR depreciation.
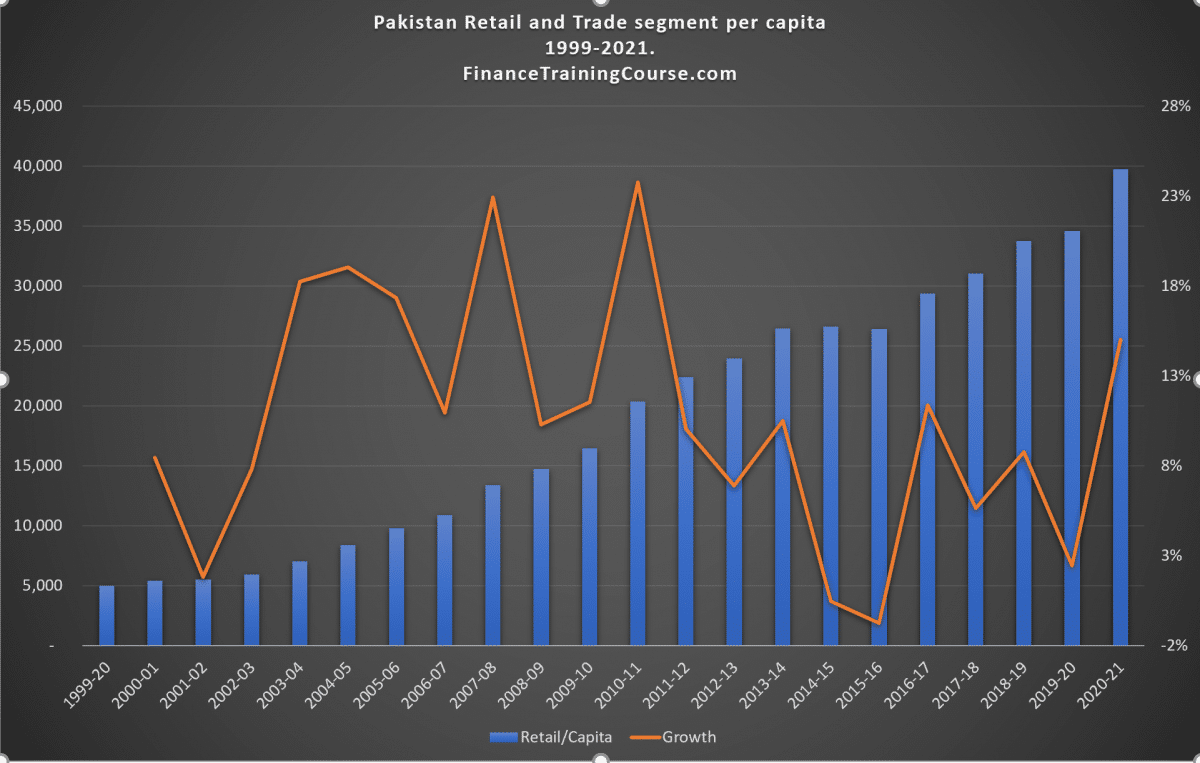
A simplistic yet workable model is to use metrics that can help project growth. One relevant metric in our case is retail/capita in PKR and US$ terms. We take total retail and trade sector estimates and divide them by population to calculate retail and trade per capita. Then divide the result by average
USD: PKR exchange rate to express in US$ terms. Rather than projecting retail or GDP sector growth, we could project growth in retail/capita in US$ terms.
The chart below shows these calculations performed using PBS data set for Pakistan.
For assumptions and calibration, you could use relevant growth metrics over ten or twenty years and compare results with trend realized over the previous two decades.
Here is the output from one such model. We can do this because we have access to the primary data series going back twenty years and can derive the relevant metrics using analysis performed on primary data. Projected ecommerce market size using this model for fiscal 2026-27 using a 20% share of the total retail segment would be US$ 15.2.
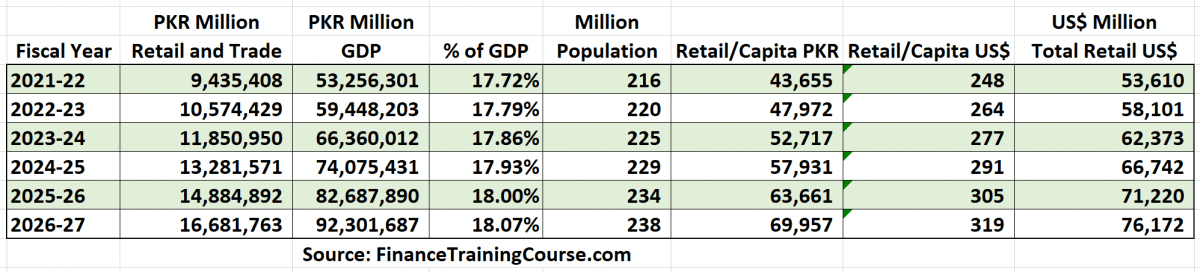
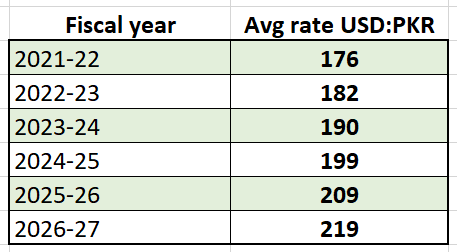
Projected USD: PKR exchange rates used in the above analysis are just placeholder rates for fiscal year averages now. They are likely to be different when modeled properly.
That is one view of the world based on the assumptions used in our model. It is not the only view, other views are also possible.
Using this analysis as our growth model, the likely growth rate in the retail and trade basket for the next 5 – 10 years is in the 10% – 12% range. Your actual estimate would depend on the structure of the retail and trade basket, capture of the informal segment by the formal sector, urbanization, middle-class growth, and improvement in roads, transport, storage, and warehousing infrastructure. These are all important questions and assumptions that need focused analysis.
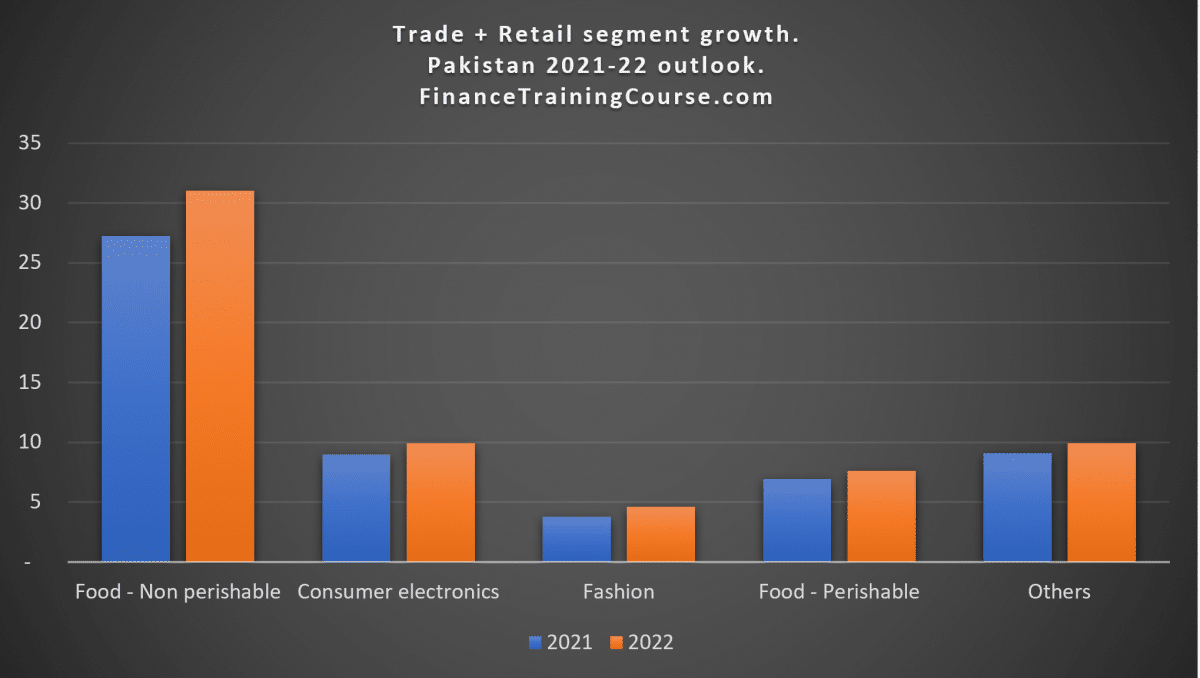
The first step in that analysis is the investigation and exploring sub-segments behind retail and wholesale trade. That is the subject of our next post. A deep dive in numbers and sub-segments behind the retail segment. Where we answer exciting questions along the lines of how much edible oil is sold in Pakistan. What do we sell more of every year? Cigarettes, fertilizers, pharmaceuticals, or cars? What is the best source of data on Pakistan’s agricultural output? Do the retail sub-segment numbers add up to our grand total and estimate above? What if they don’t?
Here is the initial output from our model as food for thought while you wait for the detailed post to come out.
Sources and methods
- Page 9, Economic Survey of Pakistan, Overview, Chapter 21, 2021. https://www.finance.gov.pk/survey/chapters_21/Overview.pdf
- https://www.pbs.gov.pk/sites/default/files//tables/rename-as-per-table-type/Table_4.pdf
- https://data.worldbank.org/indicator/NY.GDP.MKTP.KD?locations=PK