We often help and advise clients to estimate market size. Over thirty years in the field we have refined our market sizing framework by applying it across engagements in US, MENA, Africa and Far East. Every markets has its own eccentricities but the framework is generic enough to be applied across a range of geographies.
A recent engagement focused on sizing Pakistan’s e-commerce market. While sharing our finding with our client we realized that there are a number of misconceptions around the process of market sizing that can be cleared away with a simplified case study. We first present the market sizing framework followed by a summarized analysis that walks through our actual steps for answering the question – What is the size of Pakistan’s ecommerce market? Today and projected for 2022?
The market sizing framework
- Start with a world view. Where do you think we are heading?
- Find credible data. Hard market linked numbers backed by primary research?
- Validate core assumptions.
- Generate a range of estimates, not one.
- Calibrate against current and future watermarks.
- Two paths to a number.
My world view. On e-commerce
My world view is bullish. I think we are underestimating current market size.
I think it is growing bigger and faster than we are prepared to predict.
And drivers feeding the trend are getting stronger every day.
Can I back it up? A common mistake is to go out and generate scenarios for the sake of generating scenarios. Don’t do that. Build a world view. Stick to it.
You want to cover contingencies and the instance you may be wrong, build one completely opposite to your original one. But don’t build 5 scenarios that make no sense at all. Be realistic. Use realistic versions of the future. Ones that you can back with data and logic.
Find credible data
We use four data sources.
State Bank of Pakistan’s payment system review reports going back to 2018-19, results projected forward to 2022.
Pakistan Statistics PSLM survey 2018-19, breakdown by education from annual census, mobile data consumption trend from PTAofficialpk annual report. These source gave me hard data to use for estimating current market size for e-commerce using credit and debit card payments.
PSLM, Census and mobile data consumption trends are proxies and backstops for giving additional comfort to the sizing and growth estimate. Please don’t use news articles or unaffiliated publications as primary research or sources for estimating trends, drivers, markets or core data points.
Use stories to identify primary sources and then track them down. Understand sources and methods. Primary research on your market. Not an unrelated market.
Pakistan is not India, Indonesia, Philippines, Malaysia, Kenya or Nigeria. We are we. We have data. Look it up.
If you know how to find data, you win. If you can’t, you need to go back to the drawing board. Data leads to strategy, strategy to prospects.
Prospects lead to sales. Sales translate into revenues. Without data you are not going anywhere.
Validate
SBP report doesn’t provide an estimate for cash on delivery (COD) payments. For that we made phone calls.
We called friends and contacts in logistics, ecommerce market places, vendors and fellow founders to get a sense of what they were seeing in their business. Smaller businesses operating in grey markets are primarily CoD. Bigger players see as much as 23% from Cards (Card Not Present or CNP transactions).
2 years ago pre-payments via IBFT or mobile banking apps was rare. It’s still rare but more customers are opting for it for large payments. Anecdotal evidence. We know of 5 local vendors who accept IBFT transfers for both small and large payments.
Generate a range
The share of CoD payment is a core assumption. The calls helped put a range on it.
Rather than putting down a hard % for CoD we generated a range of values mapped to a range of CoD estimates.
The range varied from 95% CoD to 65%. Ranges give you the flexibility to move away from a hard figure and focus on building consensus on a world view.
The exact ecommerce size at a given point is not as important as agreeing on what is feeding the market and should form basis for a growth estimate.
Calibrate
Pakistan’s current GDP is $300 billion, give or take. What would it be 5 years down the road?
At 3% growth, roughly $360B.
At 5%, $375B.
If we rebase it, maybe even $400B+
What is the size of the ecommerce market, expressed as a % of GDP today? 5 years later? If we are at $4.6B today, that is roughly 1.5% of our GDP.
Growing at 40% a year, year on year 5 years, where will e-commerce be?
Maybe 6% to 6.5% of GDP.
What is 6% of $400B. $24B.
That is the upper cap on your estimate, in the most optimistic of scenarios. So if you come to me and say for a $400B economy, we are going to do $50B dollars in ecommerce 5 years down the road, I will most likely give you an F.
Unless you have hard data and even harder modeling to prove that I am wrong.
You can’t go from 1% to 12% of GDP in 5 years.
Two paths to a number
The 6% of GDP figure is my 2nd path to size of ecommerce market 5 years down the road.
Other ideas? What if 100% of consumer electronics switched from offline to online?
It’s $9 billion now growing at 10% a year. 5 years later, will be $13 billion. You get the drift.
Repeat for fashion, mobility, hyper local deliveries and you will get a much more robust estimate than sticking a finger in the air and guessing.
A third path is percentage of total retail sales that will be booked via online channels. A typical range for developed market is between 15% – 25% of retail sales. What would be the right figure for Pakistan? What is the size of Pakistan’s retail market? How can we size it? What are some good data sources that we can use or work with to get a sense of this figure?
Bonus point. A sanity cross check
There is one final missing trick that I kept as a bonus for those of you, who made it all the way here. A sanity cross check.
Before we make total fool of ourselves, we call some of the smartest people we know and ask them.
What do you think of this number and this approach. Does it make sense to you?
Have been saved numerous times by it. So ask for help. Don’t be shy. Asking for help shows maturity and awareness that we don’t know all the answers. It also improves our estimates and makes it possible to incorporate a wider range of world views in our estimates.
Estimate the size of Pakistan’s ecommerce market
Step #1. Go to @StateBank_Pak site sbp.org.pk/psd/reports/in…
Download all payment systems reports going back to 2018.
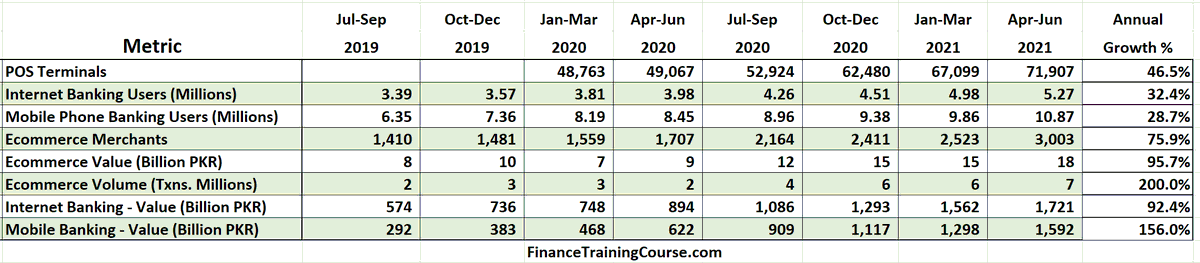
Prepare the following consolidated table in Excel. Bottom 4 horizontal rows are calculated.
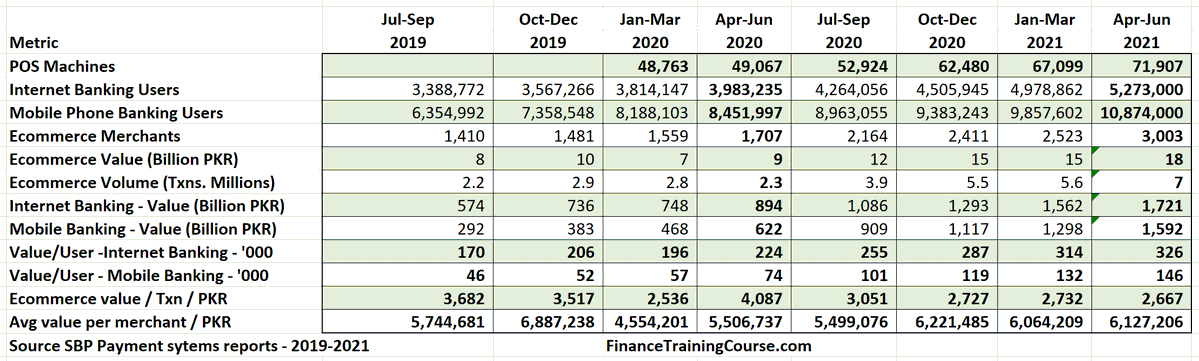
The table above can help us calculate growth rate for one full year of data from Jul ’19 – Jun ’20 and Jul ’20 – Jun ’21.
Can you extend it back to 2018 so that we can do two years of data and growth rates for above metrics. Treat this as a homework assignment.
Why did we calculate the last 4 rows? What purpose do they serve? What information, trend, direction or guidance do they show?
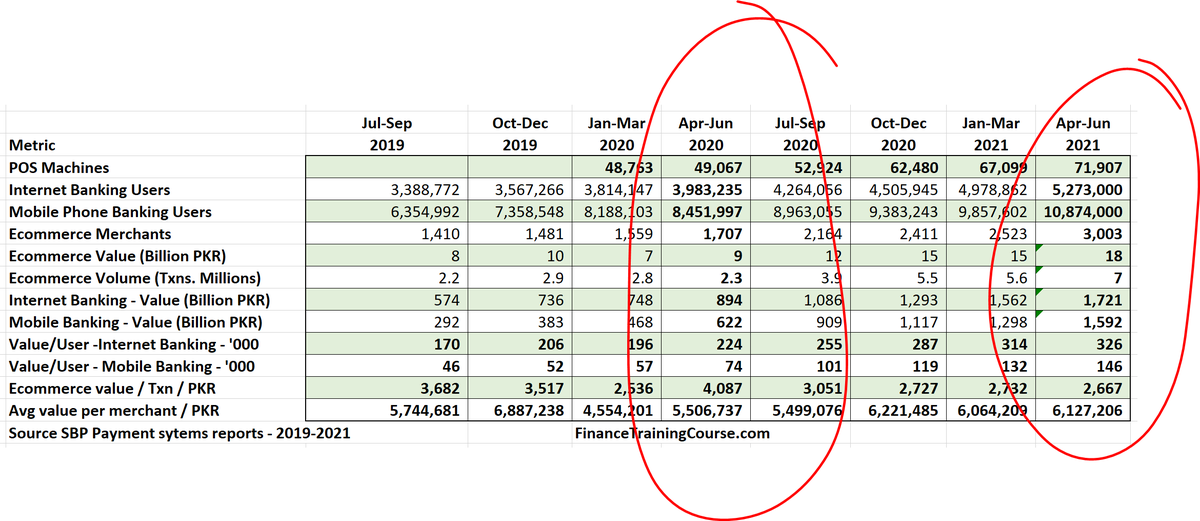
Compare Jul-Sep 2019 figures with Apr-Jun 2021 figures. You should be able to see 2 clear trends. Identify them. What’s the implication?
Annualized growth rates
In order to estimate annualized growth rate we need a different lens.
We use annualized / yearend figures for 2020 and 2021. Estimate annual growth rates from the first two columns.
Then assume similar growth in 2022 to project June 2022 figures. This is a starting point.
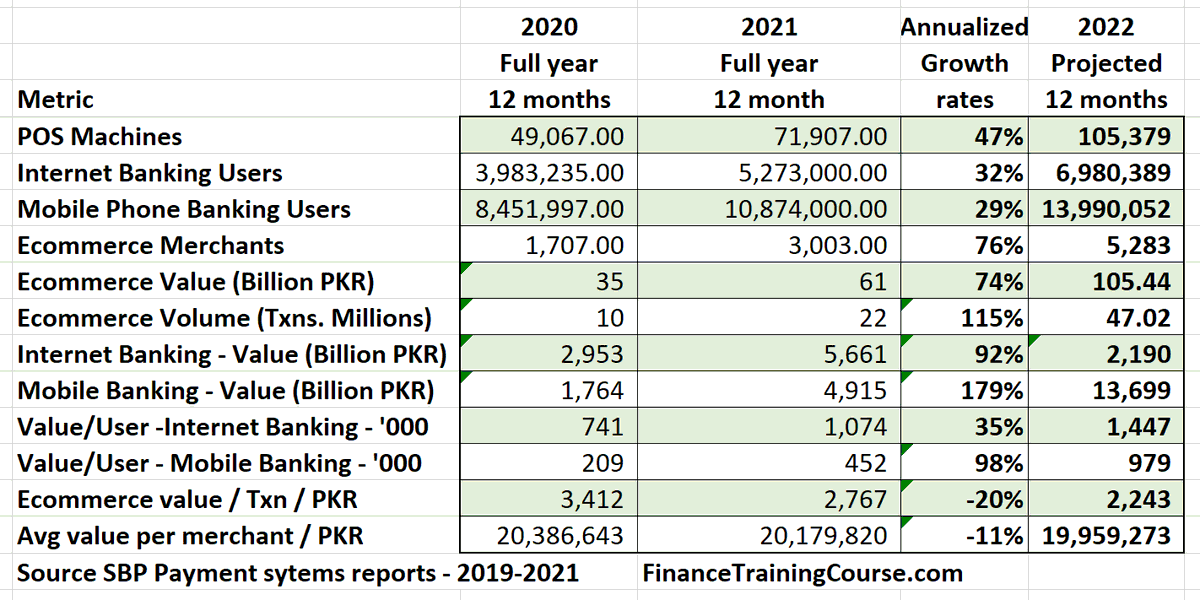
For instance, assuming above model projected ’22 figure for (a) number of registered merchants (with internet payment gateway accounts) is 5,283.
Projected (b) e-commerce payments made using credit or debit cards – PKR 105 billion.
Assumed growth rate for (a), 76%. For (b), 74%
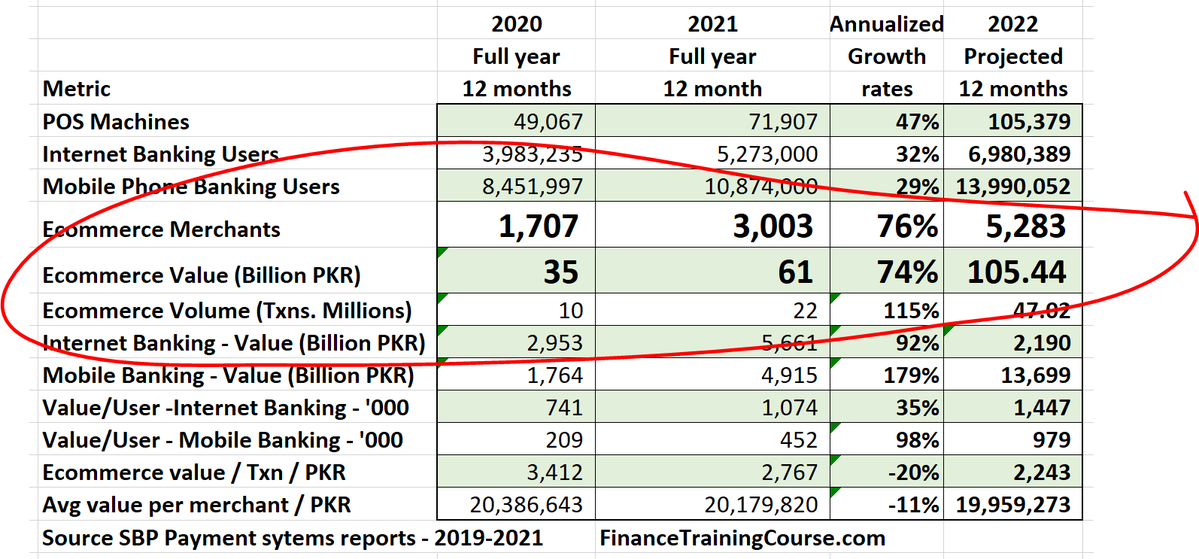
From the table above:
(a) 76% is (3003/1707 – 1).
(b) 74% is (61/35 – 1).
That is just a single year growth rate estimate. You need to project growth for 3 – 5 years. This is where your world view comes into play.
Are there any hard limits? Think, merchants, orders, consumers? That is one growth model. Here is an alternate one.
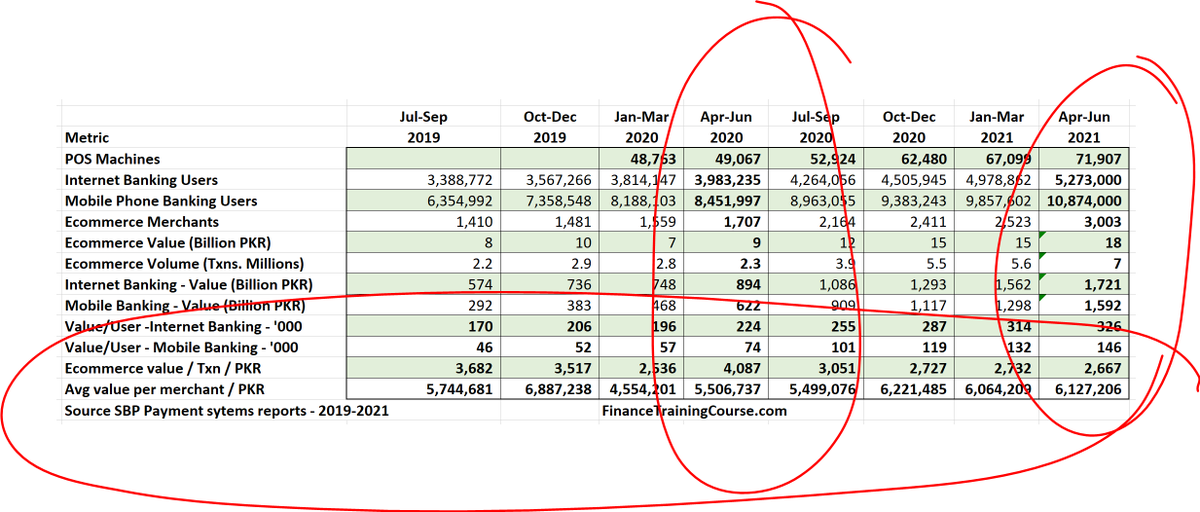
This one gives more weight to quarterly data. What do you think I have done here? Can you replicate my results?
That is rule # 1 of good model building.
Document your work so that someone else can replicate it.
Picking a growth model for your projections is an important step.
Make sure you give it the commitment it deserves.
In our case we wanted to see if recent growth was at a faster pace than historical growth.
For us that sets the basis for our growth projections beyond 2022. So far all that we have done is use SBP dataset on CNP (Card not Present) transactions.
Cash on Delivery and Total Market Size
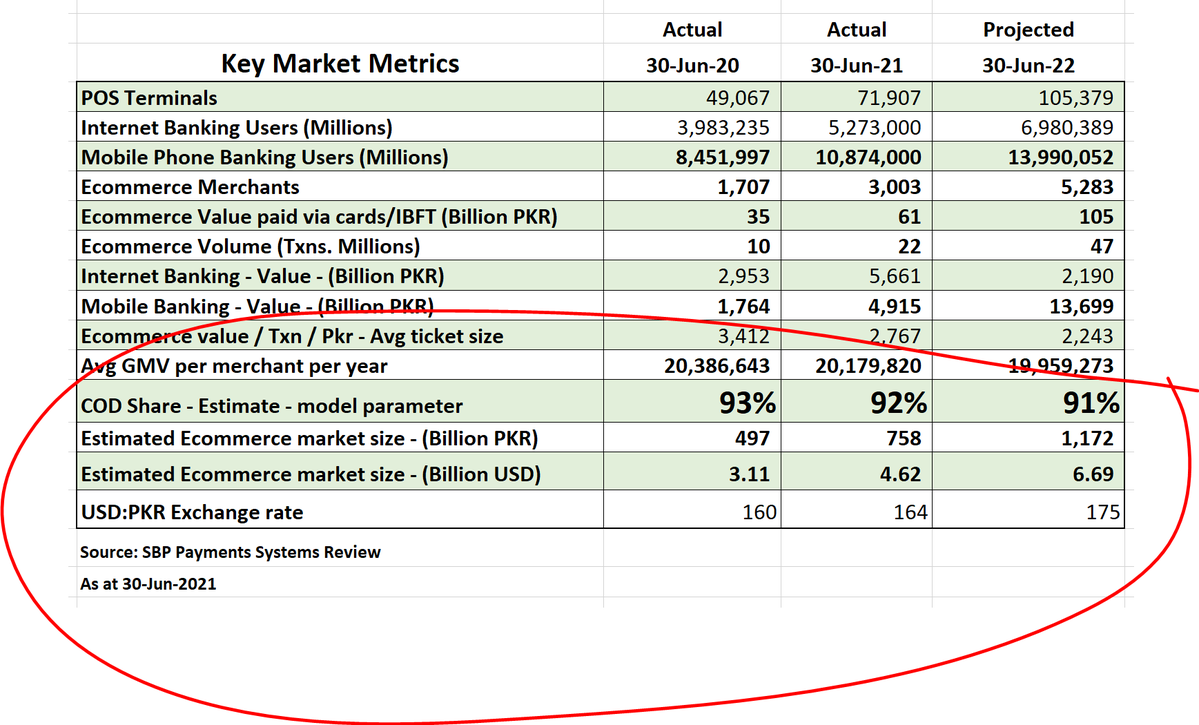
What about Cash on Delivery (CoD)? We plug in 3 different values for 3 different years.
The answer we get is a placeholder value. The real answer will be a range in a data table.
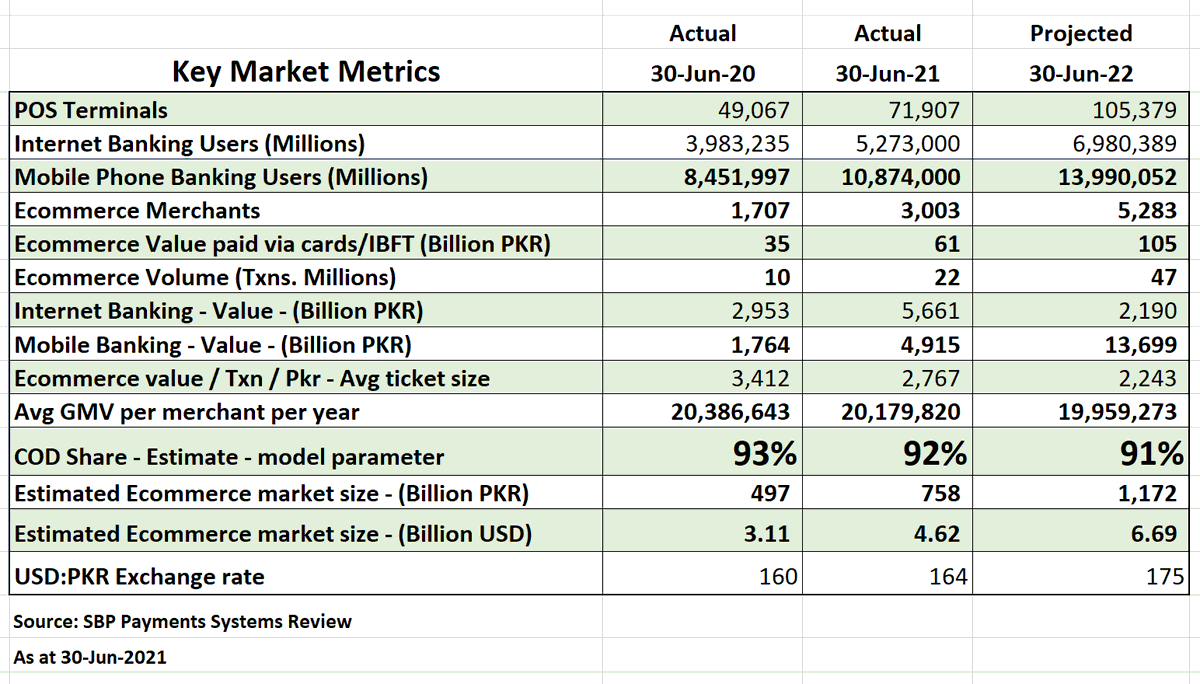
The last 4 rows is the heart of the model.
If PKR 61 Billion is 8% of the market, then 61/8% is total market size. That gives us PKR 758 billion.
Divide that by 164 (the average USD:PKR exchange rate in 2021) and we get $4.62 billion.
Same model replicated for 2020 and 2022.
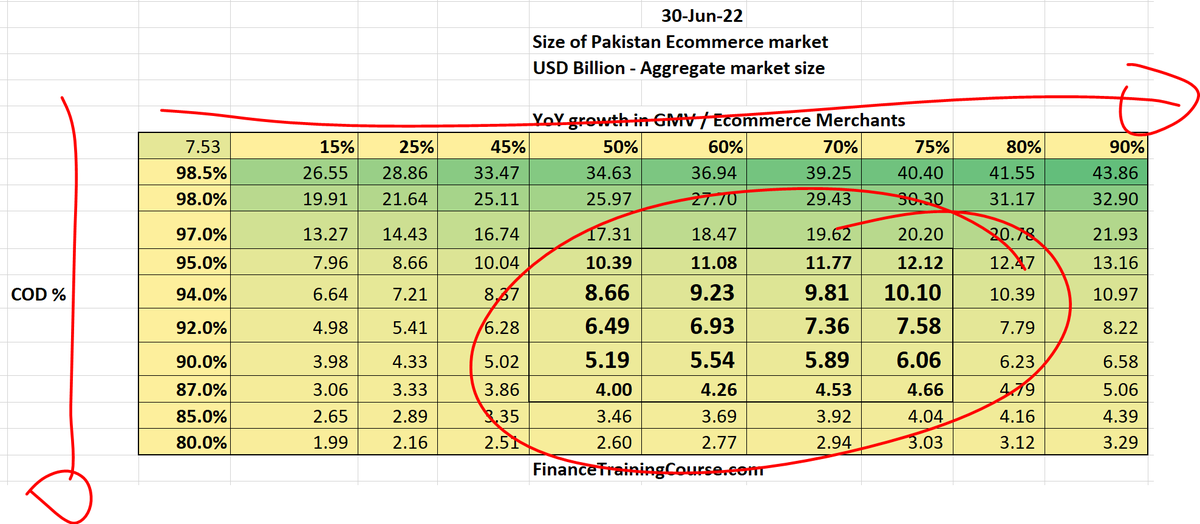
Market size estimates – range of values
Now plug in the assumed annualized growth rate and the CoD% in a data table to produce range of results to be used for discussion or presentation purposes.
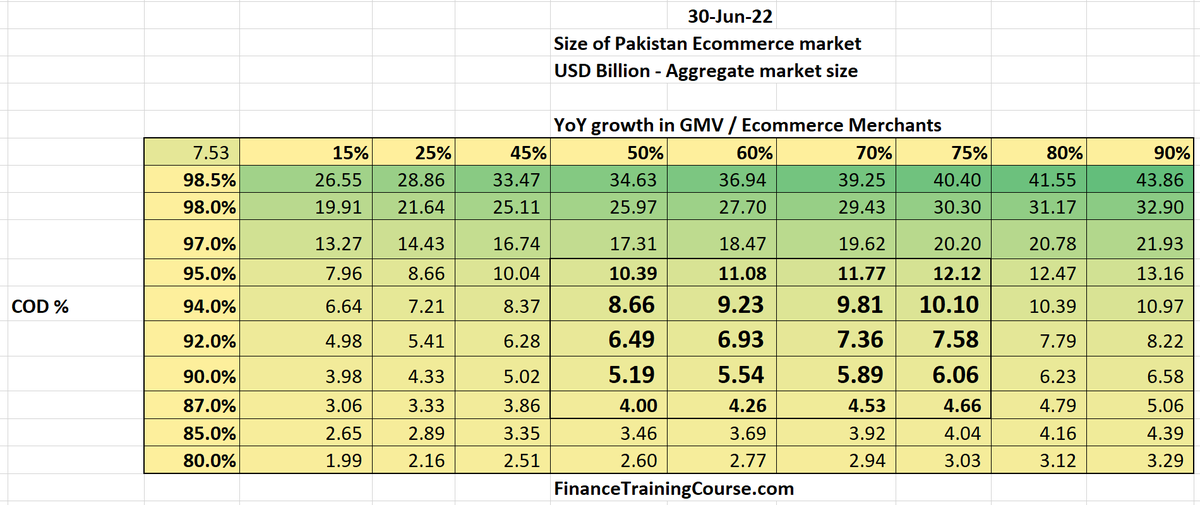
The left most column is assumed CoD %.
The top most row is annualized GMV growth rate.
The numbers in between left most column and top most row are estimated market size for combination of Cod% and GMV growth rate.
The highlighted cells in center are consensus estimate.
Estimate size for relevant market segment
Now that you have a range of numbers, the next question is what part of this market is relevant to you as a business, startup or founder? Don’t stop at sizing the complete market, size the relevant market segment?
If you do digital books, products or services, only a small part of the above segment applies to you. Mobility, hyper local deliveries, logistics? The answer will be different? If you do FMCG (Fast Moving Consumer Goods), you will be looking at a different number. Make sure you ask yourself what is the relevant segment for my business before you sign off on your final market sizing estimate.
Happy to take questions now. Go ahead and shoot them at my twitter profile at Rebootdude.
Long overdue post but I am glad we finally got it done. If you are not familiar with using data tables in Excel, please see the tutorial I wrote many years ago. A little dated but still relevant.
Remember that is just one path to this number. There are other paths also. Can you think of some that can be backed by hard data or even derived data from the above data sets?