The seven deadly sins of estimating market size. #1. Modeling choices and data sources. #2. Relevance within markets and segments. #3. Who is the customer. #4. Getting the math right. #5. Big markets? #6. Modeling Growth. #7. The elephant in the room. Estimating market size is based on a three part lecture series delivered for founders and startups at Habib University.
The seven deadly sins.
On a pleasant afternoon in March, many moons ago, I sat down with an old friend who was a telco industry insider. We were trying to figure out how big the smart phone market in Pakistan was likely to be in the next few years.
We were proud smart phone owners. I bore a Galaxy Note, he was a card-carrying member of the iPhone fan club. That should tell you that this incident is from ancient history.
Collectively we had spent 50 years in the technology, banking, and telco space. At that point we both represented our respective industry associations and had penned national policy documents for our communities.
Our best-case estimate, which we thought was unlikely, was a million handsets in 6 to 8 years. Our likely figure which we also thought was overly optimistic, was just half a million smart phones.
While we felt that the technological impact of the smart phone was significant, we didn’t think anyone would cough up a thousand dollars to step up the technology ladder. The phones were great but the ecosystem around them still had a long way to go. 3G auction was still 2 years in the future and there was neither word nor expectation of a 4G launch. A 50 dollar robust entry level functional smart phone was unthinkable. According to my friend, at that specific point capital spending within the Telco space was uncertain. They were still debating the route forward and he wasn’t sure about the timelines or capital commitment available for 4G.
Looking back our outlook and forecast wasn’t just flawed. It was laughable. Based on the best possible data available to us, it was more than an educated guess. It was a formal forecast.
Yet, out of touch and short sighted doesn’t describe an error margin of 79 million handsets, the number quoted by PTA for smart phone penetration in the country this year.
How could we be so wrong? If as insiders this was our score card, how could fresh faced founders do any better?
Market sizing is a tough nut to crack. Yet it is something founders need to do frequently. It is the first step in deciding whether a product, service or feature will find enough customers to pay back the investment required to create it.
Here is a list of seven deadly sins of estimating market size that founders and startups make.
One. Default Modeling choices. Industry reports.

What is the most common model we use when it comes to sizing markets? Pick the one that you normally use.
Option A
A google search for an industry report or a multi-lateral aid agency white paper on the opportunity it represents. Then taking a percentage of that as our primary market size. Leading to statements like:
“According to World Bank, IMF, IFC or ADB, the FinTech market in Asia will grow to 4 trillion USD in 2030.”
“According to IDG global e-learning is an 800-billion-dollar market”
Option B
Picking a valid number from a census or economic study with accurate and relevant demographic data and then applying assumptions to arrive at a figure for market size.
For instance, while estimating the size of a market for a coming of age teen adult title in Asian markets, you could start with the school going teenagers as per the most recent census. You are on the right part till this point.
Everything beyond this point would be conjecture.
For instance, how many of these children buy and read books in the language your tome is written? How many of them can read and would be interested in reading in reading a book for pleasure? How many are interested in this specific genre? How many will borrow the book from a library or a friend? How many will download a torrent or grab a pirated copy? How many will pick up the title at a bookstore? How many will read a book written by you as the author? What is the source for these assumptions?
Do you see the point I am trying to make?
Why does it matter? After all the entire financial modeling exercise is a house of cards balanced on assumptions. How bad could a handful of other assumptions be?
The approaches above are not necessarily wrong or incorrect. They are fair proxies when used appropriately. Challenges arise when we use them without doing diligence or required groundwork.
Estimating market size is more than picking up a number from an industry report or thin air or applying assumptions to arrive at a figure that appears to be credible.
Let’s revisit our book example again. You are a new author with a riveting coming of age science fiction thriller focused on young adults.
You have been smart and have been building up a following on social platforms. You have 20,000 followers on twitters, 200,000 fans on Facebook, 45,000 followers on Instagram, 8,000 connections on Linkedin?
With the right combination of social sharing, giveaways, discount coupons and other tools, you could drive sales from your social properties. Yes? The question is how many?
How many books do you think you will be able to sell through social platforms just by sharing sales collateral organically? Think about this and put down a number before you read ahead.
Assuming a 2% plausible organic reach across all platforms, you will reach 5,460 of your fans. Using an optimistic 4% you will score 10,920.
That is depressing.
Let us make it even darker. 10,920 is just reach, not conversion. Reach is feeds and timelines your message shows up in or on. It doesn’t mean the message is seen or read. If they don’t see it or read it, how will they act on it.
Of the 10,920 you reach, the ones who see your message or your post, how many will click on the prompt. Of the ones who click, how many will buy?
While 263,000 social media fans sound like a great number in a book proposal, in real life it’s the mix across platforms and how you use those platforms that matters.
Numbers from Industry reports are like Facebook fans. Industry reports have their uses but they don’t convert well to sales.
There is a second related question.
Where do you think industry reports get their numbers from? From consultants, very much like me, who wrote the reports. Where do you think consultants get their numbers from? From our models. Where do our models come from? We make them up as and when need them. There are good models, there are terrible models and there are models in between. In most instances they are not more than educated guess work. Just because they are in Excel or are accompanied by big reports doesn’t make them true.
Essentially educated guess work.
When it comes to a business you are running, your guess work is going to be as good as mine. Possibly better.
As a founder you need to own the numbers you cite or quote. What does that mean? Founders need to understand where numbers for their market size come from. They need to understand the math behind the numbers. In an ideal world they need to derive the math themselves using data generated from their primary markets. Founder driven number based on founder driven data are significantly more credible than any study out there.
Two. Markets and Relevance.
How many types of markets are there? Which ones are the most relevant?
I know as founders we like quoting figures for the global market size to give the world a sense of how big a problem we are trying to solve. But is that relevant for a startup?
Quoting global market size for diapers makes complete sense if you are doing the keynote for the regional sales conference for the diapers manufacturing association of the world. Because you have the manufacturing capacity, the marketing prowess, the sales network, the advertising budgets, and distribution muscle to reach any corner of the world in the next twelve months.
But you are a startup. Three people working out of your living room in the clothes you slept in last night. Compared to the soulless, blood sucking goliath you are planning on beating, you are still wearing diapers.
Global markets? I don’t think so. You need to survive local, national, regional markets first before you will have the bandwidth to tackle anything larger than that. The first three are going to keep you busy for a while.
Multi-lateral aid agencies quote global markets because they need to raise funds from donors across the world and the only way to justify their cut is to highlight the size of the problem or the lives they are going to reach. Consumer goods manufacture look at global markets because they need to balance the opportunity such markets represents against demand trends in the long term. These are nice problems to have but it will be a decade before you will get around to them. You will have more urgent problems to address before you need to worry about global markets.
So then should you waste any bandwidth or air worrying about the size of your global markets. The short answer is no.
Tell me about local markets, markets you can reach and serve today. Markets that will take you seriously. Markets that will open their doors and their wallets for you and not shut you out.
For instance, rather than selling fresh produce to the world, show me how you are going to sell Fresh produce in Karachi. Not all of Pakistan, just Karachi. Or wherever your start up is based.
Make the math work locally, then expand.
How many markets are there?
Total fresh produce consumed and sold in Karachi is one.
Total fresh produce consumed by households is two.
Total fresh produce consumed by middle class households in Karachi is three.
Middle class households we can reach through your message is four.
Middle class households we can serve through your network is five.
Middle class households we can reach and who will give a try is six.
Any one of these is more relevant than total global market for fresh produce.
While there are national, regional, and global markets for fresh produce, we don’t want to bother with them at this stage. From the list of markets above, the most relevant to us are four, five and six. But we can’t get there without one, two and three.
Our market share is a function of four and five. Households we can reach and serve. As our reach and network expands, four and five will also expand. Given the size of this market, four and five are likely to keep us occupied for a long time.
There is a big difference between the entire market for any given product in a city like Karachi (One) and the number of people who are likely to consider buying the product from you (Six). Within the narrow lens of Karachi as a market, one is Total Addressable Market. Six is your best case for Obtainable market share.
A presentation that starts with a narrow focus on households we can serve, and reach is more credible than one that starts with quoting the global market size. As a founder you need to own and understand the math for these two numbers.
Focus on what is relevant for you as a startup at the beginning. Local market share. Leave everything else for consultants, multi-lateral aid agencies and giant consumer brands that can manufacture, sell and distribute diapers across the world.
Three. Who is the customer?
Why middleclass households? Who are you estimating the market size for?
If the estimate is for the city government that needs to setup smaller submarkets to ease distribution, reduce wastage, and simplify tax collection you need the entire consumption figure. If you are a startup that is planning on delivering farm fresh produce to your customers by helping them place orders online, you need a different figure.
What is the profile of customers who are likely to place an order for fresh produce online? Someone who has access to the internet, actively uses their smart phone and buys fresh produce but doesn’t have the time to pick it up from the corner vegetable and fresh produce stand. Someone who is willing to wait. Since there is a lag between placing the order and its delivery. Someone who is willing to pay a little extra in prices for better quality produce and pay delivery charges for the convenience of ordering online.
Not everyone fits that profile. Internet usage, smartphone, spending power, willingness to pay for better quality and convenience are attributes that fit a middleclass household well. But not all middle-class households are open to ordering online, paying a little extra or waiting.
Middle class households are also risk averse and are unlikely to be early adopters of new technology, unless the technology delivers significant value and has credible social validation. Of the households you reach through your marketing and media campaign a small percentage will try your product initially. With traction and social proof, the numbers will rise till this segment becomes your most important source of recurring orders.
Understanding the profile of your customer and applying it well to your market sizing estimate is key. It is a common mistake to assume that your product or service will appeal to an entire class or segment of customers. It won’t. Please adjust your estimates accordingly.
That is the difference between potential customers you can reach and customer who convert.
Four. Getting the math right.
How would you go about estimating the market size for fresh produce consumed in Karachi?
Where would you start? You would start by defining fresh produce. For our exercise we include vegetables, fruits, dairy products, and meats in the fresh produce section. Why? These are items our startup is planning to deliver to consumers.
Let’s try two simple approaches before add complexity to our models.
We have two choices.
Model A. Start from the top, also known as a top down estimate. The top down approach starts with some overall broad market estimate and then uses assumptions to drill down to a more focused figure relevant to our exercise.
Model B. Start from the bottom, also known as a bottom up estimate. The bottom up approach starts with a single unit of consumption and then aggregates consumption across some criteria to reach our market sizing estimate.
Why do we need two models?
Two paths to a number make it easier to cross check and validate our figures. Two sources or models that lead to similar conclusion and ranges are more credible than one, if we haven’t deliberately selected assumptions to get that result.
You can use one model to calibrate the other using an iterative approach. Let’s take a simple example to illustrate the process.
Top Down vs Bottom up
Model A. Top Down.
- What is Pakistan’s GDP?
- What proportion of that GDP is Karachi?
- What proportion of that is food?
- What proportion of food is fresh produce?
Quick answers:
- USD 300 billion
- 35%
- 30%
- 20%
If we multiply our answers together, we get
300 * 35% * 30% * 20% = USD 6.3 billion per year.
That is a big number.
Model B. Bottom up.
- What do middle class homes spend on food per month?
- What proportion of that is fresh produce?
- How many middleclass households are there in Karachi?
Quick answers
- 30,000 a month
- 20%
- 2 million
If we multiply our answers together, we get
2 * 30,000 * 20% = 12 billion
In our first pass the two approaches don’t reconcile, which is common. The two passes give us a range that lies between USD 6 and 12 billion a year for fresh produce consumption in Karachi.
We will come back and revisit the reconciliation later. For now, let us take a deeper look at some of our answer choices.
How did we get the budget figure for food for a middle-class household?
We did a rolling average of our own weekly grocery shopping bill. Scaled it down by removing all the extra discretionary stuff. Asked around for opinions across friends on how much they spend per week. Compiled the results and voila, an informal anecdotal estimate for household spending is ready. This informal anecdotal estimate is orders of magnitude better than a number plucked from thin air. While informal, it is still based on a nugget of real data.
The same informal exercise yielded a rough breakdown of household expenditure. We took an initial estimate of 20% for fresh produce.
But a second pass on that data shows that once you include meats, fresh produce share in the household budget jumps to 80% for households in the upper middle class. Fruits and vegetables by themselves are around 30%.
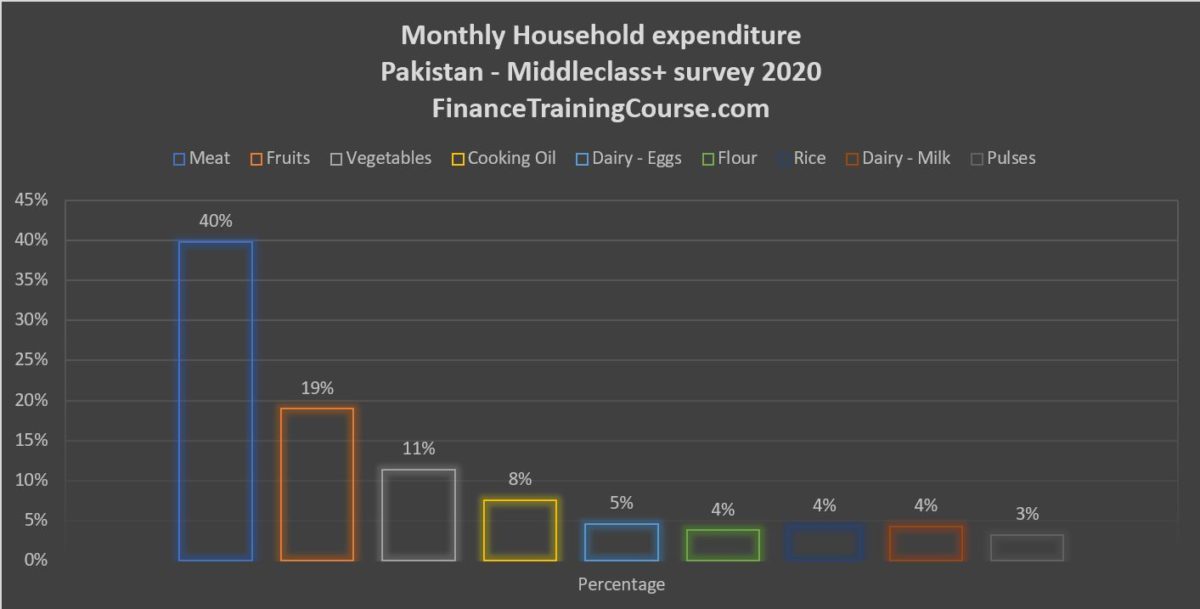
Ignoring meats if we just look at fruits and vegetables and plug that in our equations above for Model A and Model B, our estimates change again. With a 30% share for fresh produce in the middleclass household budget, our estimates for Model A and Model B are USD 9.45 billion and USD 18 billion respectively.
The data above also shows us the biggest consumptions heads in terms of value for such households. Cooking oil, flour and rice. Eggs are already very competitive and carry the breakage risk. But oil, flour and rice are easy categories to expand into if you have the storage capacity and the distribution muscle.
What is the source for the number quoted for middleclass households in Karachi?
See Pakistan Middle Class estimation challenge. It is a summarized presentation of two seminal and respected papers written on the composition of the Pakistani middle-class. In December 2017, the papers put that estimate at 12 million households. We have assumed 2 of those 2 million are in Karachi. With an average of 5 members per household that puts the middle class in Karachi at 10 million individuals. Please note that middle class ranges from lower middle class to upper middle class and average individual per household range from 4 (single family upper middle class) to 8 (joint family middle class).
But you just said don’t quote a multi-lateral aid agency or industry report?
The Pakistan Institute of Development Economics (PIDE) Paper by Dr. Dur-e-Nayyab is based on analysis of the Pakistan Social and Living Standards Measurement (PSLM) dataset – a survey based on 80,000 contributing households – collecting data since 2004.
Real data with meaningful analysis is always kosher. The problem we have is with drive by shootings. Picking a number from a report driven by assumptions and quoting it further without context or appropriate analysis.
There is still room for significant improvement here.
Five. Big Markets. Because they are there.
If a big market exist, should you go for it?
Just because a large market exist doesn’t mean that you should try and tackle it. Even if it is USD18 billion in size. Great ideas and markets need to pass a few tests before you spend a few years of your live trying to make them work.
We are not fans of the fresh produce market. Admittedly it looks attractive because of its size. It isn’t. It is a terrible market. The big issues are operational complexity, credit worthiness of customers and cold chain logistics.
Fresh produce is perishable. You can run it through a cold chain but that also requires educating everyone in the chain. From growers, packers, movers, shippers, storage owners, workers, and couriers. Without that education, the logistics of moving fresh produce in Pakistan is an operational nightmare.
Take the example of shipping fresh cherries from Gilgit and Hunza to Karachi. The primary supplier and packager is cold chain certified. The mover who moves it on his cold chain trucks from Hunza to Islamabad airport is also cold chain trained and certified. But the ground crew for the airline carrying it from Islamabad to Karachi leaves the 300 kg shipment out in the heat on the runway first in Islamabad and then again in Karachi. The team that brings it in from the airport, given the odd hour the flight lands, has no other option but to bring the cherries to the primary warehouse that does not have a cold store. With the right temperatures in the chain, cherries would have a shelf life of ten days. With the abuse they have suffered, they are done in three.
Outsourcing delivery out to partners doesn’t always work because you have just shifted the education challenge to a partner. Margins in logistics and shipping aren’t thick enough to do that well. Damage, theft, and wastage remain a recurring challenge.
Keeping customer happy and satisfied is another battle. You have set the expectation for farm fresh produce. You are charging a premium for convenience. If you drop the ball on both goals, you are not going to hear gentle complaints. You will face a torrent of rage on all social platforms.
Finally, credit. While retail customers pay upfront or on delivery, corporate clients including kitchens and restaurants run on a tab. A single month credit balance turns into two, two into three, three into four, four into zero.
You need an infinite amount of patience, a background in agricultural supply chains, a high threshold for pain, a fanatical focus on service quality, a commitment to delivery and deep pockets to make it work.
If you can, you have my respect and gratitude. Most people can’t.
Six. Growth and other complications.
Markets grow over time. They don’t remain static. Do your estimates reflect that?
Most founders use static market size estimates because they don’t understand market dynamics or don’t have access to source data. Both are big handicaps for founders.
But growth is a double-edged sword. Founders sometime use it to justify entering markets that may not necessarily work at inception but may grow into something acceptable.
To illustrate, an example.
Everyone gets excited about payment systems and the opportunity they represent. I do too. Every single time I hear someone break the ground on a solution that will make the cash on delivery problem go away.
How big is that market?
We look at the state of card-based payments as a proxy for the health of the e-commerce industry in Pakistan. Our interest is that of a payment solution provider and we want to get a sense of how big this market is right now as well as how big is it likely to be in coming years.
The source of our data is the State Bank of Pakistan, payment system report, issued every quarter. The report is prepared by the Payments Systems team at SBP and is based on details of transaction data submitted by the banking industry to the regulator. You can’t get more credible or reliable data in this space. This is source data, data you get if you drink directly from the hose.
You can find the latest SBP PSD report here
http://www.sbp.org.pk/PS/PDF/PS-Review-Q3FY20.pdf
The e-commerce payments market is defined as ecommerce payments processed via or through credit or debit cards in Pakistan using internet payment gateways. This is different from payments processed on the same cards using point of sale (POS) terminals.
There are two tables of interest in the payment systems report. Table 5 and Table 14 that give us a sense of growth, quarter on quarter. We base our analysis on Table 14.
The difference between the two tables? Table 5 includes payments made on cards issued by domestic (Pakistani) banks by domestic consumers to domestic vendors. Essentially local payments, or payments likely to be processed by local payment systems solution provider.
Table 14 includes all card payments processed irrespective of domicile of issuer or vendor.
This is data from Table 14, the all-inclusive enumeration of card payments in the e-commerce space.
At the end of 2019, in the most recent reported quarter for that year, payment systems were projected to book 16 million card-based transactions worth PKR 70 billion made by 4 million customers. The projections were arrived at by annualizing most recent quarterly figure of PKR 17.6 billion recorded in the Jul-Sep-2019 quarter. In the SBP report table you can find this figure under the Q1-2020 heading.
By June 2020, six months later, the figure had moved upwards. Q2 is a big quarter for e-commerce vendors in Pakistan. A mix of holiday season, yearend clearance sales, special events, weddings, and social promotions.
In the next two quarters after Q1-2020, the quarterly figures jumped.
Half year figures came in at 10.3 million transactions and PKR 43.3 billion which put the annual market size at 20.6 million transactions and PKR 86.6 billion.
What is the likely figure for the full year when data for the final quarter of 2020 (Apr to Jun 2020) is released? Do you think it will be higher or lower?
Remember Pakistan went into lock down in the last week of March 2020. Ecommerce deliveries were curtailed to essential supplies. Store fronts and restaurants were closed across the country. The lock down was eased after six weeks in May. But by that time the economy was already in a deep recession.
That is half a quarter with minimal activity followed by a half of deep spending cuts.
Prior to these results, the quarterly growth rate in value was roughly 16% per quarter. Growth for the year using the last four quarters was 48%. The next two quarter pushed it to 30% growth, quarter on quarter. The last quarter for 2020 will most likely show negative growth because of the lock down imposed in the last of March till middle of May 2020. Year on year the growth figure will most likely come in in the low 50% for the year. Without Covid-19, the lock down and the accompanying contraction it should have cracked 70%.
For our projection, we can ignore the Covid-19 related contraction as a temporary blip for 2020.
What will the market be worth by 2024? How big will the underlying opportunity be by year end 2024?
That depends on what you define as the market. If you are Visa or Master Card, you are interested in the size of the entire pie. All cards, all vendors, irrespective of domicile.
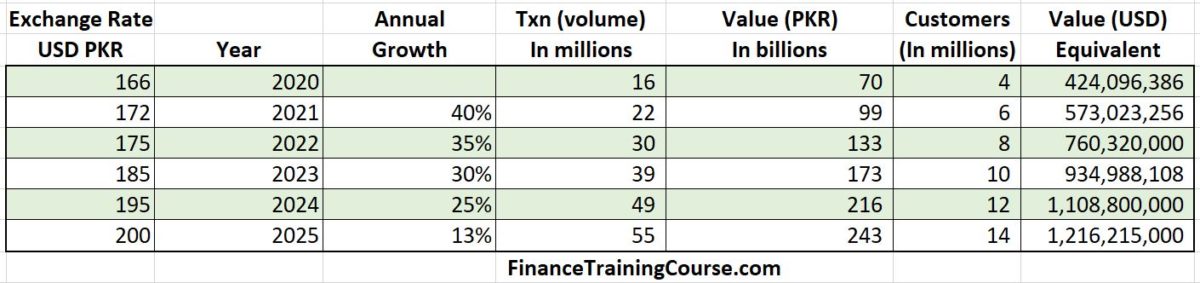
As per the SBP report, Table 14 (page 6), the size of that market pre-Covid is roughly PKR 17.1 billion in value and 4 million transaction per quarter growing at an annual rate of 48% a year using data from the pre-Covid four quarters.
On an annualized basis, this translates into 16 million transactions a year and PKR 70 billion projected for 2020. Using the projected exchange rate of 156 at the time of publication of the payment systems report, this give us a 2020 market size of USD 448 million. Four months later due to exchange rate adjustments in USD terms the market is down to a slightly lower USD 424 million. Using the more optimistic projections based on the recent updates to the PSD report in June 2020, the market is likely to be USD 540 million for the year.
This is all credit card transactions, local as well as international processed on local cards through the internet or on an online channel.
If you are interested in providing a local payments option to e-commerce vendors so that they can get away from the tyranny of cash on delivery models, the number above is meaningless. You need the local cards processing market.
The local only cards processing market is much smaller and depending on the exchange rates used is half the size. Using the same SBP report, we estimate the local cards processing market to range between USD 200 million to USD 230 million as at the end of 2019. The optimistic figure using the updated 2020 data is USD 270 million for the year.
We can project this to year end 2024 using assumptions ranging from pessimistic to optimistic.
The resultant projected market size falls between USD 1.15 billion to USD 500 million based on the assumptions, cards and transaction mix used.
Did you notice the slowing growth rate as move further towards the future?
Markets can’t grow at astronomical rates forever. If you are in the cards business as a bank, while the numbers look really exciting the growth game is likely to be over by 2028-30, if not earlier. It won’t be just because the market is slowing down. That will be a factor, but it will primarily be on account of increasing availability of alternates to existing payment choices.
Seven. Competition. The elephant in the room.
We continue with the payment processing example because it illustrates the next point perfectly.
Our estimate for 2024 payment processing market was USD 1.15 billion. The local market is roughly half this size. Not exactly multi-billion-dollar opportunity FinTech Asia had promised but it is still a large number.
How many ways are we going to slice this pie?
- The Chinese represented by Easy Paisa, Telenor Bank and Ant Financials along with Master Card payment processing solution.
- Jazz cash and their future potential acquirers. They are likely to follow the path defined by Easy Paisa and Ant Financial in competition for market share.
- A top 5 banking network driven offering that sits somewhere between cards, m-wallets and low-cost transfers – most likely HBL.
- A smaller bank-based m-wallet offerings and ecommerce platforms as and when they are offered. Unlike HBL or UBL a smaller, hungrier, nimble bank that wants to leverage its banking license to make a focused payment play and is willing to deploy serious capital to chase that goal.
- Careem pay within the next few months if not earlier.
- Finja Simsim, Foreepay, Sadapay, Phonepay, Safepay and other nimble competitors in stealth mode.
- Any other bank with a case of digital envy who decides to come after this market after reading the FinTech Asia multi-billion-dollar opportunity article on their last flight.
The first four on the list above will take away 80% of this market. Why? Because they are already in the space, they have budgets to spend, the infrastructure in place and can afford to take big hits. Their service quality may suck, you may hate their brands, but they are still going to win.
Everyone else will end up fighting for the remaining scraps.
Twenty percent of USD 500 million market is still a hundred million dollars.
Split eight equal ways it comes down to 12 million dollars each. But that is in 2024-25. Today the market is worth USD 270 million. 20% of that is USD 54 million. 54 million split 8 ways is less than 7 million dollars each for anyone who wants it today.
My apologies if I was rude or awkward or ended up disappointing you. Did you really think while you were busy drawing plans to rule the world, everyone else was just going to sit back and let you do it?
When my clients mention billion-dollar opportunities in a payments system play, I don’t see a billion dollars. Neither should you.
I see teams working exceedingly hard over the next 5 years to book 5 to 10 million dollars in processed revenues using payment technology they have built. Assuming the market continues to grow at 30% a year, year on year for the next 5 years.
There is a final nail that needs to be struck in this coffin.
I once worked for a business that processed thirty thousand transactions and a billion dollars a month in value. We charged a flat fee per transaction. There were just three competitors in our space because what we did was difficult to get right.
While the numbers sound impressive, they weren’t enough. It wasn’t pretty and it didn’t end well.
It didn’t end well with a billion dollars a month in processed volume and three competitors in 2003. Our best estimate for the payment space in 2020 is 54 million split 8 ways. Do you think this is going to end any different? It is going to be uglier.
The market share above is not revenues. It is processed payment. Revenue is whatever they can get away with charging for processing these payments. It’s not going to be a lot.
But you can figure that piece out on your own.
Certainly, the payments business is more than cards. But we have forty heavily capitalized established old school banks subsidized by their primary business and eight new entrants focused on competing for that business.
In the payments business as a startup, cards are not the way to go if you are serious about owning this market. You can’t play the game on incumbent terms. You must build your own game. Sure you can use cards to get a foot in the door and pay for the infrastructure required to build up capacity for the real game, but you must have a different plan in your back pocket.
You can’t get to this conclusion unless you do the math. If you are still relying on Fintech Asia for market size estimates, you will start broke and hungry, work yourself to death for ten years and remain broke and hungry.
Conclusion
Numbers, not manners, maketh the man or the woman. Own the numbers, validate them even if it is with anecdotal evidence. Real data is always kosher so go look for it. Remember just because a big market exists doesn’t imply that you need to tackle it. Remember you can’t have it all. You will have to share it with competitors.
Founder Puzzles
Estimating Market Size is an extract from Founder Puzzles, a book by Jawwad Farid on the math that matters for your startups.