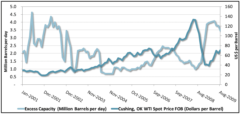
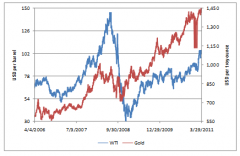
Correlation Analysis – plotting data in EXCEL
3 mins read We take a quick look at plotting data and price series in EXCEL for correlation analysis and presentation. The plot
3 mins read We take a quick look at plotting data and price series in EXCEL for correlation analysis and presentation. The plot
2 mins read Correlation is a term used to define the relationship between variables (e.g. prices, returns, volatilities etc). In terms of the
2 mins read If you want to go ahead and build your own Value at Risk (VaR) model for equities, currencies, commodities and bond, check out the Calculating Value at Risk Course below. Within the calculating VaR course we walk through VCV (Variance CoVariance) and Historical Simulation, Portfolio Value at Risk and VaR for Fixed Income securities.
< 1 min read A focus on ICAAP – Pillar II risks primarily ALM and Liquidity Risk Capital using Interest Rate Simulations. The two day main event is preceded by a single day foundation workshop on Internal Capital Adequacy with a focus on treasury, market and counterparty risk management.
< 1 min read Repricing limits Repricing limits are set for interest rate management. These limits control exposure by controlling the volume or amount
2 mins read Other Limits Duration Limits Duration measures the sensitivity of the price of the product/ value of the portfolio to changes