Volatility surfaces – everything you ever wanted to know but were afraid to ask.
Volatility Surfaces, for an option pricing student, is that dark corner of the room that you don’t want to venture into after seeing a really classy horror movie.
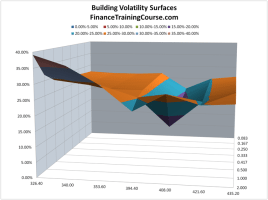
For the last few days we have been creating a calibrating volatility surfaces tutorial for our audiences. The material, the model and the Excel spreadsheets are almost ready and will be available for sale later this weekend. Topics covered in the tutorial include volatility smile, volatility skew, local volatility and volatility surfaces. The accompanying Excel spread sheet begins with raw data and shows how to build a step by step model that leads to the three dimensional surface diagram in Excel you see below.
Just in case you were wondering why do you need to get involved in what appears to be a fairly painful and involved process. In addition to option Greeks, volatility surfaces is the last topic that gets covered in a graduate level course on option pricing. Most schools and professors give it a wide berth since it generally is based on an advance practitioner level understanding of the subject. If you are familiar with Black Scholes equation and pricing models used for pricing European options, calibrating volatility surfaces is one of the tweaks market practitioners use to side step the constant volatility assumption.
While we had been thinking about writing on the subject for the last few months, our priority changed when a customer requested we do something on this subject a few weeks ago. Keep your eyes peeled, the tutorial will be here sooner than you think.
And yes we would love to hear any recommendations and feedback you may have on how we should go ahead and price it. Feel free to drop me a note at jawwad at the rate financetrainingcourse.com
Comments are closed.