One of the most common questions I face as a consultant deals with how do you actually implement Value at Risk. What are the challenges with Value at Risk?
Here we use implementation more along the lines of interpretation of value at risk rather than physical implementation. Clients understand that systems need to be purchased, controls need to be created, data needs to be gathered but once everything is in place and you are getting your 2,500 risk reports every day, what do you do next. The actual challenges with Value Risk are: How do you actually read the VaR reports and how do you link it to controls and what do you or do you not share with your senior executive team and board members?
Implementing Value at Risk
In 1997, the world of finance, risk management and Value at Risk (VaR) watched in silent awe as Nicholas Nassim Taleb and Philippe Jorian went after each other in Derivative Strategies on the merits and demerits of Value at Risk (VaR). Jorian coming from an academic background was the unfortunate author of the only textbook on the subject of Value at Risk. Taleb, an outstanding speaker, author and unconventional trader questioned everything Jorian said as a trader. Taleb finally took mercy and issued his famous list of 9 rules for staying out of trouble with risk management that are still an integral part of practical, everyday risk management.
- Rule 1 – Do not do what you do not understand.
- Rule 2 – Your worst losses are going to be different from your last worst case loss. Expect the unexpected.
- Rule 3 – Question everything; do not accept anything at face value.
- Rule 4 – Watch out for steady trading incomes.
- Rule 5 – The markets will follow the path to hurt the highest number of hedgers.
- Rule 6 – Follow prices and changes in prices to build an instinctive inference.
- Rule 7 – This event never happens in my market. The fact that someone never died before does not make him immortal.
- Rule 8 – Never cross a river because it is on average 4 feet deep.
- Rule 9 – Learn from losses, not profits.
I was one of the many silent spectators watching Taleb and Jorian at work in London. My job in September 1998 was to decipher how the rubble left behind by the collapse of Long Term Capital Management would change the Value at Risk calculations and the internal market risk VaR model at the most well known and envied Investment Bank on the planet.
Value at Risk models next crossed my path when I started building Value at Risk, Capital Charge and Internal Capital Allocation models for FX derivative products. From vanilla options to cross currency swaps; from forward contracts to naked proprietary book positions, the primary question my trading customers would ask would be how sure you are about this market risk hand waving and the market risk model behind it. I would shrug and point them to Nassim Taleb. It was an easy exit.
Over the next few years traders, regulators and board members all caught on to the fact that there was a missing element in these calculations. While we were using market risk models to generate complex VaR calculations, the challenges with Value at Risk was that there was not much we were doing with these numbers. The market risk numbers were calculated, reported and filed. Limits were set, exceptions happened, were approved and we moved on. There was no real time process in place that would create value. And frankly speaking, the original set of reports were boring, difficult to read and present and possibly irrelevant.
Asking the right questions
As we worked more with smarter traders, controllers and advisors, we slowly started to build an understanding of the core questions that needed to be answered when it came to value at risk.
The first question was the same question we had been asking for the last decade.
How much can you possibly lose on a bad day? The answer was the market risk number given by Value at Risk by position, ticker, and portfolio.
But the next question, the next challenge with Value at Risk, was more interesting and contentious. How much capital should you put aside for a bad day? The contention arose because you had a choice of using regulatory standards (99% VaR, a win for Jorion but reinforcing Taleb’s 9 rules above). Or using lower percentile conditional puts by position, ticker and portfolio.
The passing of a decade also made sure that there were now many more text and books available on this subject and we could drill down to what position would need to be cut and by how much if a VaR limit was breached. We identified the answer by asking another question. How do the above two numbers change due to the addition of this position? (I-VaR by position, ticker and portfolio)
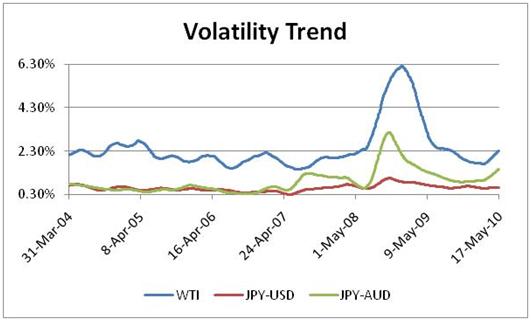
And then finally Taleb’s rule of monitoring and watching changes and trends and patterns over time. How does recent risk compares with historical risk compares with the true distribution? (VaR trendline, SMA & EWMA VaR). We did by volatility trend analysis by calculating sixty day moving averages of daily SMA volatilities in the given look-back period. The daily SMA volatility itself was calculated based on prior sixty return observations. The graphical depiction of the trend line shows the average volatility of the next sixty volatilities at a given point in time. An upward sloping trend line indicates that the average volatilities are increasing, a horizontal line shows stable volatility levels, whereas a downward sloping trend line shows declining volatilities.
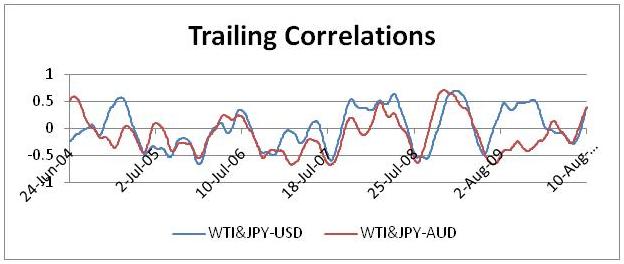
The real gem in this improvement was the concept of trailing correlations. Taleb’s deepest fears about market risk models stemmed from correlations breaking down. And while we were still looking in the rearview mirror we could at least begin to visualize and accept the facts that correlations were not stable and would break down at the first signs of trouble.
Using the right VaR models
As is the case with all practitioners, as we solved new problems (sometimes creating other more difficult to solve problems), we started building up an inventory of biases and prejudices. I greatly like Monte Carlo simulation as a tool for dissecting structures and testing pricing and hedging strategies. I hate it (Monte Carlo simulation) when it comes to modeling risk. I realize that the Historical Simulation approach has many significant limitations but over the years, it’s the only approach that has shown some sense of stability. As Taleb puts it, history is not going to repeat itself, you are not going to be hit by your last worst loss and the next big wave that will wipe you out will not come from where you expect it.
My respect for historical simulation grew when we started modeling Value at Risk for cross currency swaps. Two separate currencies, two separate interest rates, two separate term structures and about a thousand assumptions in between. I would look at the end number our Monte Carlo simulator would throw out in amazement and wonder how could any reliance be placed on something that is literally stitched together by chewing gum and baling wire. While there were challenges with Value at Risk determined using the Historical simulation approach, at least it reduced the assumption set and the usage of historical price data set across currency pairs, rates, term structures and markets, and made it a lot easier to explain to traders. Traders understand and respect price and price histories. They question assumptions. A model that uses raw prices unfettered by drivers and assumptions for a trader is infinitely superior to a model with more assumptions than equations.
Linking Value at Risk with Stop Loss
But I think the biggest breakthrough for us happened last year when we finally managed to link the Value at Risk with Stop Loss Limits. The intuitive leap that made this possible came from nowhere and addressed the question I had been personally trying to answer for the last few years.
Stop loss limits act as a safety valve in case something starts to go wrong. Stop loss limits state that specified action must take place if the loss exceeds a threshold amount. Tight stop loss limits reduce the maximum possible loss and therefore reduce the capital required for the business. However, if the limits are too tight they reduce the trader’s ability to make a profit.
The first step in setting stop loss limits is to determine the appetite of the company regarding its risk tolerance. This translates to specifying the amount of capital that the company can afford to lose. The leap that we made was to link the risk appetite to the Value at Risk model, which in turn fit in snuggly with the stop loss limit structure.
Comments are closed.