Value at Risk Models – Value at Risk, Marginal VaR, Incremental VaR & Conditional VaR
Our latest addition to our Excel downloads library. A spreadsheet that shows how to calculate the different flavors of Value at Risk on the same data set (SMA, EWMA, VCV, Historical Simulation, Marginal, Incremental & Conditional Value at Risk – VaR). On client engagements we often run into questions about which VaR model tweak is best and closest to reality and why. Sometimes its best to simply take the data series and run the numbers.
VaR Model library – EXCEL Examples
Which is exactly what we have done here. One Excel sheet, five different variations. See the Value at Risk Excel walk through post for a detailed review of the sheet.
For a portfolio comprising of positions in Crude Oil, EUR-USD, Gold and Silver the excel sheet calculates:
- Variance Covariance VaR using the Simple Moving Average Approach for individual positions as well as the portfolio
- Variance Covariance VaR using the Exponential Moving Average Approach for individual positions as well as the portfolio
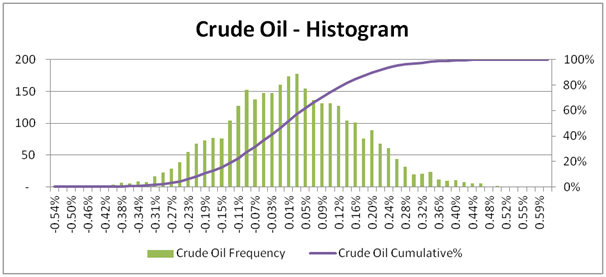
- Historical Simulation Approach with Histograms for individual positions as well as the portfolio
- Monte Carlo Simulation Approach with Histograms for individual positions as well as the portfolio
- Incremental VaR for small changes in positions using the approximate approach
- Incremental VaR for small changes in positions using the full valuation approach
- Marginal VaR to calculate the reduction in VaR if a position is dropped from the portfolio
- Conditional VaR to calculate the expected excess losses, i.e. average loss amount given that losses exceed VaR for individual positions as well as the portfolio
- Probability of shortfall assuming that investment returns fall below a given goal for individual positions as well as the portfolio