How do you manage liquidity risk for a fixed income portfolio. How do you stress test liquidity risk for the same fixed income book. What are the primary drivers used in the liquidity stress testing model?
There are questions that come up regularly in our interaction with students and customers. This post will first try and introduce a framework and then do brief walk through of an approach that we think is suitable for fixed income portfolio liquidity risk stress testing.
Liquidity stress testing fixed income book – core model drivers.
If you buy a bond today, what are you really worried about?
- The risk of default: risk that you will not receive principal or interest or both when due.
- The price risk: risk that interest rates will move against you (rise). In the case of corporate debt risk that both interest rates (rise) and credit worthiness (decline) of the issuer will move against you.
- The risk or large positions: risk that when the time comes to sell or liquidate the position, buyer interest or trading volume would be insufficient to cover your large order or position.
- The risk of funding mismatch: risk that the deposit or liability you have booked to finance the purchase of this asset will not roll over or the cost of funding would rise to a level where holding the asset would no longer be profitable.
Of the above list (a), (b) and (c) directly impact the price of the bond or position being sold. (d) impacts the profitability of the position and possibly the need or desire to liquidate it if it can longer be funded profitably.
Therefore if you build a liquidity risk model there are a few primary drivers that you need to focus on:
- The first is events that would lead to a sale, willingly or otherwise.
- The second are events that would impact prices in such a way that a sale would be necessary on account of stop loss limits.
- The third are events or factors that would make the sale difficult or possible only with a significant loss in value
- The fourth are events or factors that would make the sale necessary on account of funding mismatch.
Your liquidity risk capital against any fixed income portfolio or book will therefore be driven by a combination of the above four factors.
- Price movements that trigger stop loss limits
- Concentration risk in terms of issue size, trading volume and open interest. Concentration will then impact your calculation of expected liquidation period and the expected price loss using a model similar to value at risk analysis.
- Funding mismatch on account of re-pricing of the deposit/product that was used to finance the asset.
From a stress testing point of view you want to look at extreme values for the three factors above ranging from likely to exceedingly unlikely. Your stressed capital requirement would work of the unlikely scenario, since the objective of the stress test is to see how your portfolio would perform when market around it are not performing.
The model would remain similar to a value at risk model, except that holding period would now be defined by your maximum liquidation period under stressed conditions. Please see our simplified guide to stress testing for board members for the stress testing framework.
For the model to function you need interest rates, credit spreads, bid-ask spreads, trading volume by issue and security, security issue size and distribution of holding across buyers and issue specific yield to maturity (YTM) data for the issuers in question. Without the above data, the model will not work.
The underlying optimization and risk capital estimation model will remain the same as our original fixed income optimization model however rather than allocation, you would need to focus more on capital charge estimation. This can be achieved with a few minor tweaks to what data is captured and the form of the objective function.
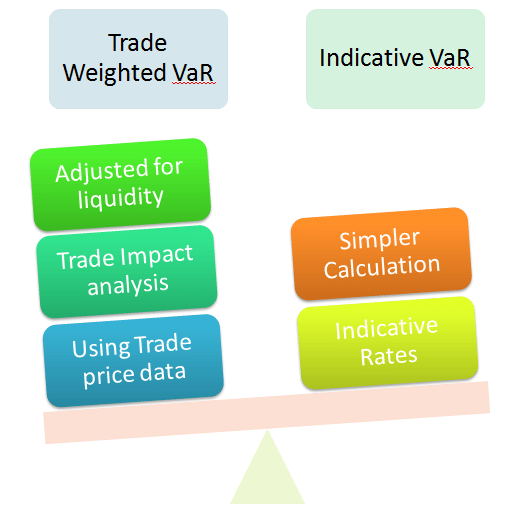
In the short run, if all of the above extensions are not possible to your original Value at Risk model, there is a simple tweak to your reporting format that can have a much greater impact. In most emerging and non-liquid market in the absence of real trade data we use proxies such as indicative rates. Which presents a problem.
Here is one possible partial solution to missing liquidity adjustments to your value at risk estimates. On a monthly basis track average traded volume and yields for those volumes. If possible track the impact of changes in volume on indicative yields. When you report Value at Risk numbers using indicative rates, add a simple qualification. These results are based on indicative yield with traded average market volume at 100 million per month at an average yield of 4% with an average lot size of 1 million. Any changes in volume and lot sizes will impact liquidity adjusted value at risk estimates.
For stress testing needs, track the relationship between volumes and jumps in traded yields. Similar to linking Value at Risk (VaR) to liquidation period, add a chart showing marginal change in volume, yield and price impact in a simple table at the end of your Value at Risk report.
Please note that this approach is different from the Liquidity Risk Capital Approach for a bank balance sheet as well as the Liquidity risk guidelines and liquidity coverage ratios mandated by the Basel III updates.
Comments are closed.