Monte Carlo Simulation Model How To Guide
The Monte Carlo Simulation how to guide is a combination of session transcripts and class notes from a lecture on Monte Carlo Simulation applications. The lectures focused on building a solution for the fuel hedging problem for the airline industry. The collection of posts were written to serve as a self contained Monte Carlo Simulation model building how to guide for students.
This first post walks through the model context and background, while the following posts review the actual model building exercise based on the themes and requiremnts presented here.
Monte Carlo Simulation Model – Case Context & Back Ground
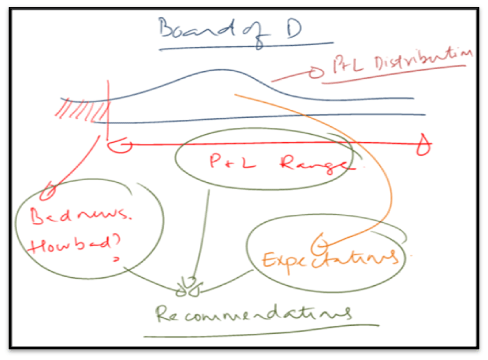
Within the airline industry the largest contribution to variable cost is the fuel expense. Airlines use fuel hedges, fuel surcharges or a combination of both to manage the risk of changing oil prices on their bottom line. The objective of the case modelled in the class was to prepare a presentation for the Board of Directors advising them on two primary questions:
- Should the airline move forward with a fuel hedging program?
- If yes, what should be the correct hedge ratio? The hedge ratio represents the percentage of fuel expenses hedged by the airline.
Monte Carlo Simulation Model – Initial Analysis & Requirements
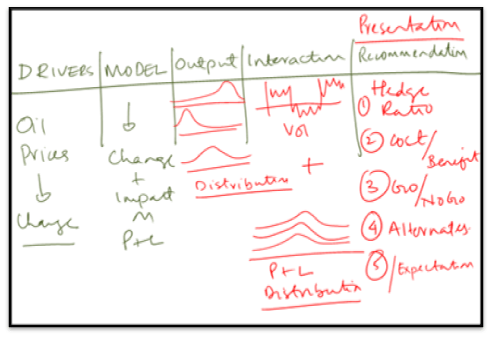
Our initial analysis suggested that the airline was exposed to oil, currency and interest rate risk. However, both volatility and impact on P&L were greatest for unanticipated changes in fuel expenses. This risk was aggravated further by aggressive fuel hedging strategies used by the competition which if successful would leave our client with a significant disadvantage. Compared to oil price risk, the impact of currency and interest rate risk was a small fraction of simulated P&L.
The objective of our model was to therefore:
- Simulate crude oil prices
- Use changes in crude oil prices to model demand for fuel as well as total fuel expense for a given period
- Use Monte Carlo Simulation to generate a distribution for operating margin
- Understand interaction of model parameters; Volatility, Ticket Demand, Hedge Ratio, Operating Margin & Probability of Shortfall
- Make recommendations to the board based on the analysis performed above

Monte Carlo Simulation Model – The two black boxes
The primary model output required for the above goals was simulating price per unit consumed as well as units of fuel consumed. We decided to use WTI as our primary blend for forecasting crude oil prices. Since the airline purchased fuels in tonnes, rather than simulating price per barrel of oil, our model simulated price per tonne.
There is a strong correlation between Crude Oil, Fuel Oil and Jet Fuel prices and it was decided to create an initial black box for the correlation between these three products. The initial black box would serve as a crude approximation and would be refined later as the model was calibrated to market prices. Initial analysis indicated that while the average correlation was strong, it was not stable and experiences significant instability under times of market stress & volatility.
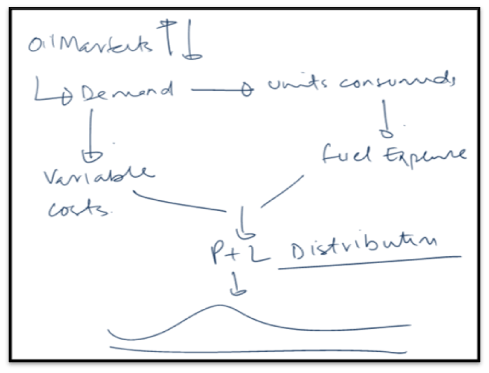
In addition to fuel expenses, we also linked ticket demand (and in turn Gross Reveneus) to changes in fuel oil prices. The assumption here was that higher oil prices beyond a certain acceptable threshold ultimately lead to global recession and lower demand for air travel and vice versa. Also in addition to fuel, other items linked to the volume of flights and passenger miles flown were linked to the demand model. The original demand model is a simple black box which can be upgraded in a later iteration.
Monte Carlo Simulation Model – Identifying relationships that need to be examined
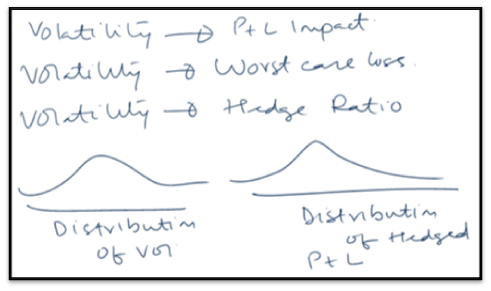
We were also very interested in examining the impact of volatility & correlation on hedge effectiveness as well as the P&L distribution. From a model output point of view this had to be a “must have” requirement without which meaningful and practical recommendations to the Board of Directors would not be possible.
Finally whatever output the model produced had to meet the requirements for a Board of Director presentation. The presentation should present final recommendations backed by analysis generated by the Monte Carlo Simulation model and must:
- Factor in the instability in correlation between different drivers in the model
- Focus equally on hedging as well as non-hedged scenario in a neutral, unbiased fashion
- Give a ranges of values for likely, extreme and worst case scenarios possible based on historical oil price volatility
Comments are closed.