The downloaded implied volatility dataset from your volatility data sources generally includes the following information:
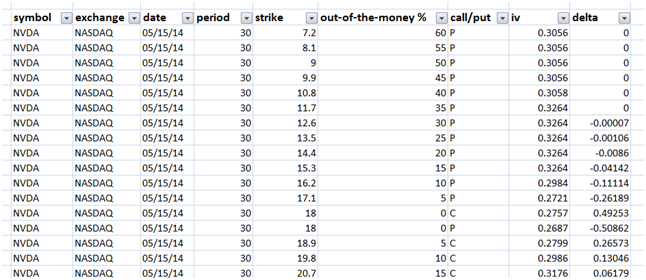
Figure 1 Raw Implied Volatility dataset
For a quarterly sample data snapshot on a daily basis it is not uncommon to end up with a few thousand rows. To build a volatility surface dataset we need a much smaller focus.
One option is to cut the dataset by Maturity (expiry, T) and Strikes (K) as shown below. Options are sorted using date and period filters and we get all combinations of implied volatilities by strikes for a given expiry date.
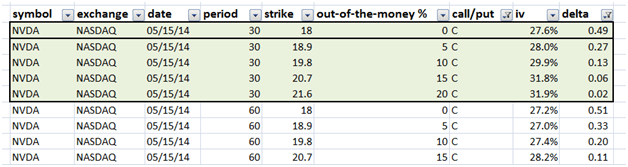
Figure 2 – Volatility Surface data cut – option one
A second possible cut is to focus on all possible implied volatility values by expiry dates for a given strike price. This is the approach that we will opt for in our model building exercise in Excel.
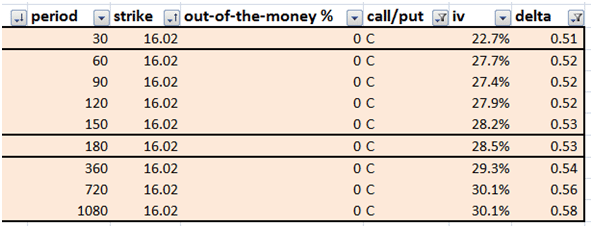
Figure 3 Volatility surface data cut – option two
We use the filter option in Excel to select a given date and then sort the data set by our maturity by strike combination. The end result on your sheet should look something like the following panel:
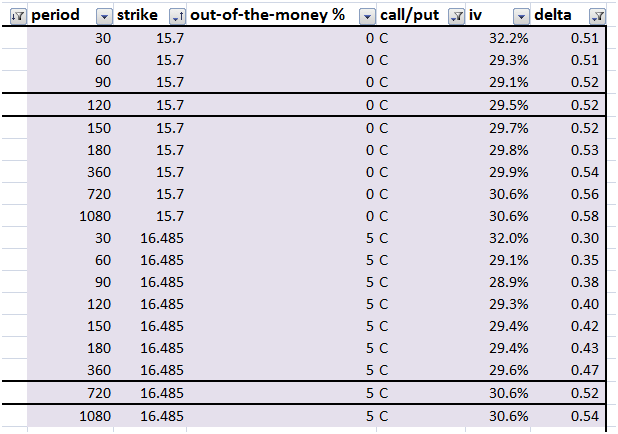
Figure 4 Volatility surface data cut – option 2 revisited
The date yields 9 maturity buckets which are then translated into yearly figures by dividing each of them by 360. The assumption here is that there are 360 days in a year.
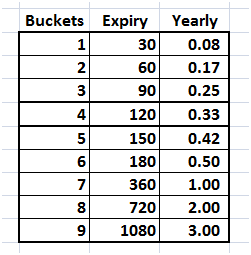
Figure 5 Volatility surface data cut – maturity buckets
On 31 Jan 2014, there are 13 available strike prices for call options on NVIDIA.
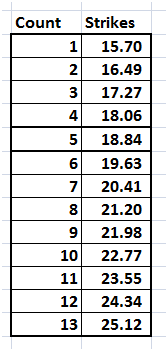
Figure 6 Volatility surface data cut – available strikes
When we use the combination of maturity buckets and strike prices we get a grid of implied volatilities.
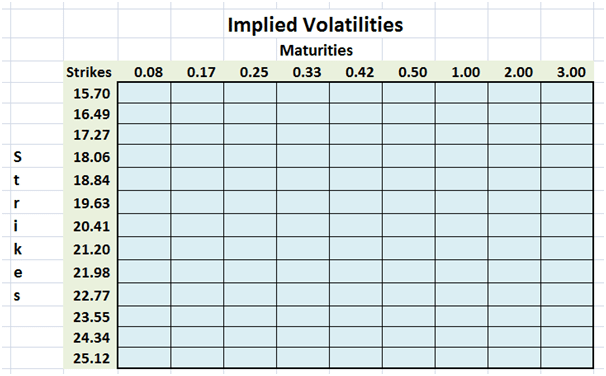
Figure 7 Implied volatility blank grid for volatility surface
Our final step is to fill in the grid based on implied volatility data from our data source. The final grid produced below becomes the starting point for our next lesson.
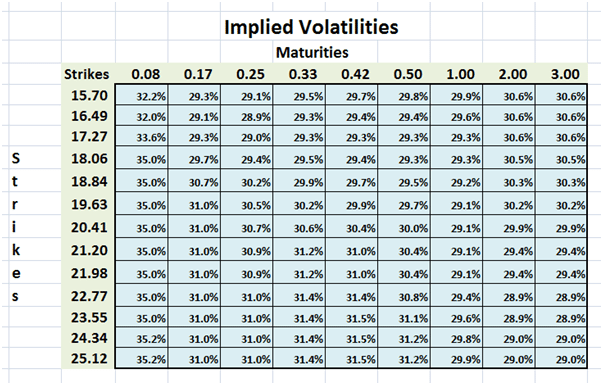
Figure 8 Volatility Surface – Implied volatilities from source data
This is raw implied volatility data provided by our data provider. If we plot a surface with these volatilities, it will be relatively flat as seen below:
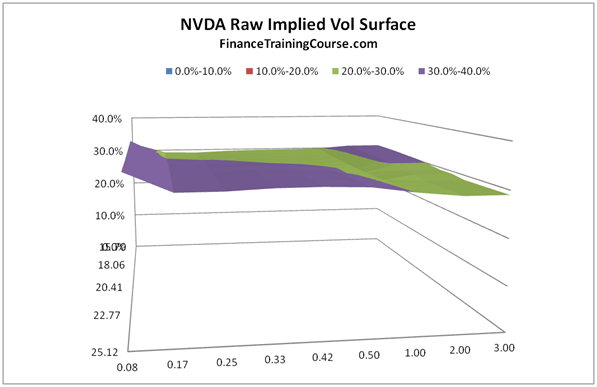
Figure 9 Sample Raw Implied volatility surface before calculation of local volatilities