A simple case study
Theoretically speaking in the Black Scholes world the cost of the hedge should be close to the theoretical value of the option. In our cash accounting P&L we have included the theoretical premium received which is used in determining the initial amount to be borrowed. If we take the premium out of consideration in the PnL, the PnL figure should be centered around zero.
To see if increasing the frequency led to better results, we increase the time steps used from 12 steps to 365 steps. The graph below plots the Net P&L to Theoretical Value across 100 simulated runs. A value close to 100% means that it is a close match to the premium whereas a value farther away for 100% indicates a poor match.
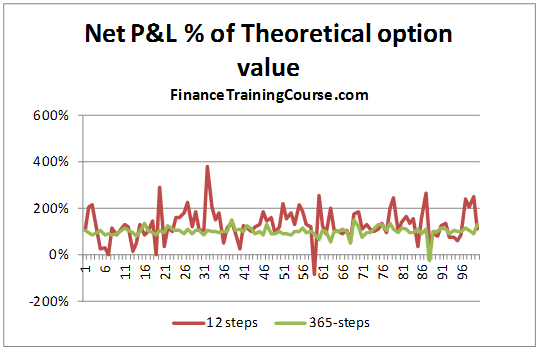
We can clearly see that there is much greater variation when the rebalancing is done on a monthly basis than when it is carried out on a daily basis.
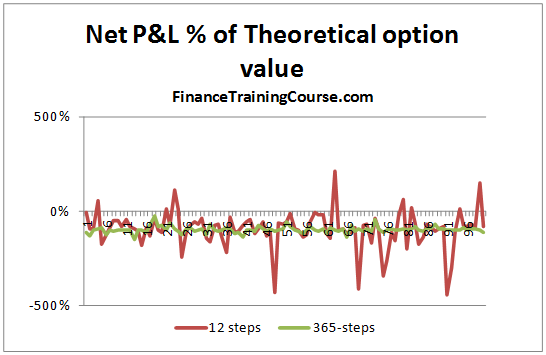
The graph below gives a similar picture. In this case, however, the premium is not considered when determining the amount to be borrowed at option inception, i.e. the hedge is fully funded through borrowing. A value of -100% indicates that the Net P&L i.e. the cost of the hedge, in this case exactly matches the theoretical value of the call option.
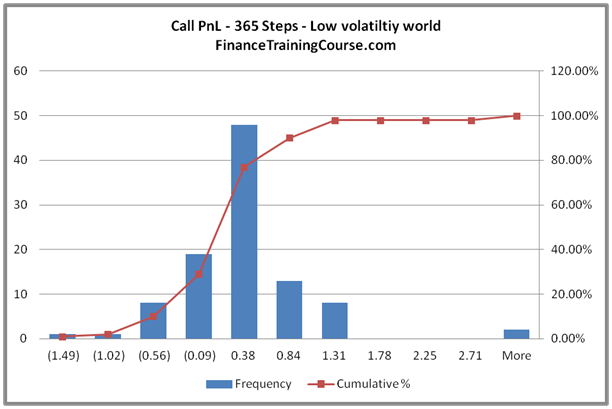
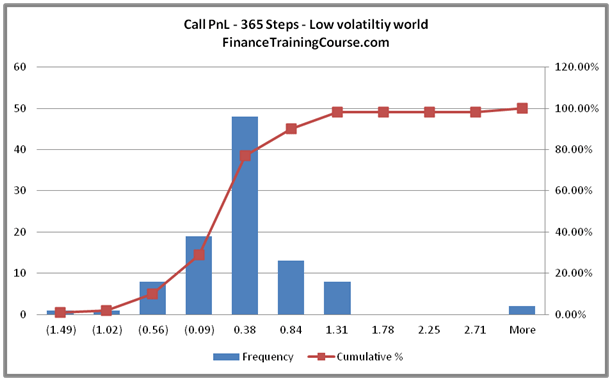
An alternate way to look at the same data set is to plot a histogram for both daily as well as monthly hedging. The next two figures present the results when we plot a histogram for PnL results from 100 iterations from our 12 step as well as our 365 step model.
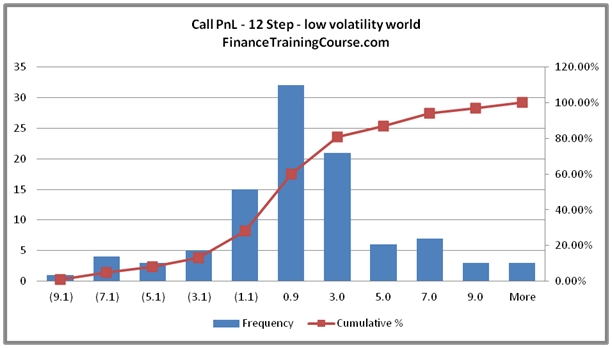
We again see the same trend.
PnL distribution for the 12 step model, as expected, is significantly more dispersed compared to the 365 step model. From a probability point of view only 47% of the distribution is centered around zero for the 12 step model. That number rises to 67% for the 365 step model.
But that is the risk manager’s point of view. What about a trader’s point of view?
From a trading point of view, there are two lessons here. First, the large variation in P&L linked to jump’s in the underlying price is the un-hedged Gamma at work (Is that true? Think about it). By daily rebalancing, you update prices and delta on a daily basis. In the monthly model, your delta model is supposedly correct for the entire month, which we know is not true. The error creeps in and is responsible for the divergence in results you see.
Second, would you prefer to limit the cost of hedging the option to the amount you have charged your customer or less? If you are in the business of earning a living from writing options, the premium you charge on the options you sell should always be higher than your cost; your cost of effectively hedging the option.
Now back to the Gamma question. Gamma is your second order error term. Conceptually it’s similar to convexity and linked to changes in not just the underlying price but also volatility.
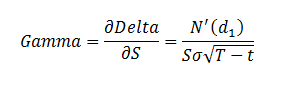
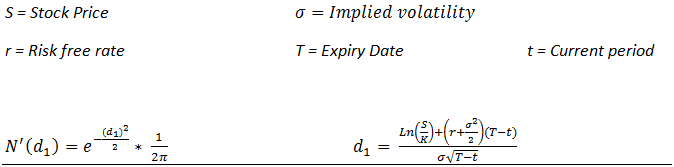
Where:
Is your true P&L (the premium received less the actual cost of hedging) the summation of the hedge error? How would you go about answering this question?
The Gamma correction. The impact on delta hedging P&L
Here is one approach that we can use to answer the above question. How big is the impact of gamma correction and if we made it how would that change the distribution of PnL that we have seen so far.
To make the gamma correction we need to adjust our estimate of delta and plug in a revised delta (and hopefully improved delta) in our simulation model.
We modify our original 365 day model by making a simple adjustment. Rather than using delta in estimating the units of the underlying security we need to purchase to hedge our exposure we will use delta plus the gamma correction adjustment. This revised value will now include the second order error term we miss out when we use our linear unadjusted delta estimates.
Rather than using the Black Scholes formal definition of gamma, we will numerically estimate it using the modified gamma methodology covered earlier by observing the actual change in delta in our simulation and using that as an input to our gamma approximation.
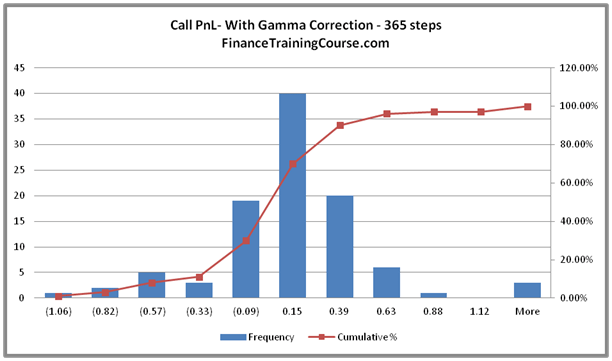
Once we have made the adjustment, we run our hedge PnL simulation again. The results of one hundred iterations are summarized below in the form of our standard PnL histogram. For comparison purposes, we also reproduce the original (unadjusted delta PnL). Since visual comparison are occasionally uncertain, we also reproduce the actual distribution results from the two simulations.
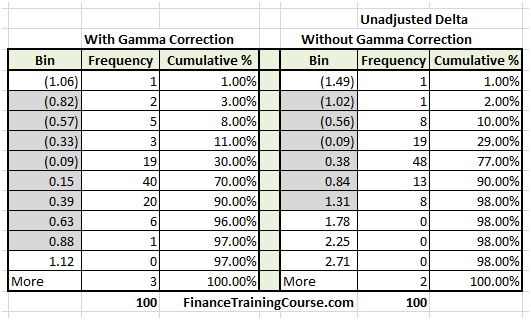
We can see that the results in the revised simulation with gamma correction are more tightly centered around zero and the dispersion we had seen in the original 365 step simulation has also been reduced by making the gamma adjustment.