Default ALM strategies
In our last post, we looked at a history of US Treasuries’ yield curve shifts between 1978 and 2010. In this post, we will review the ALM strategies employed by banks against common yield curve shifts.
We now move to a simplified analysis of the maturity distribution of assets and liabilities on a bank balance sheet in anticipation of expected yield curve shifts. We use a stylized template (shared below) to review the maturity distribution of assets or liabilities for a given interest rate scenario. Our objective is to review the tool kit of established ALM strategies and responses to common interest rate outlook changes.
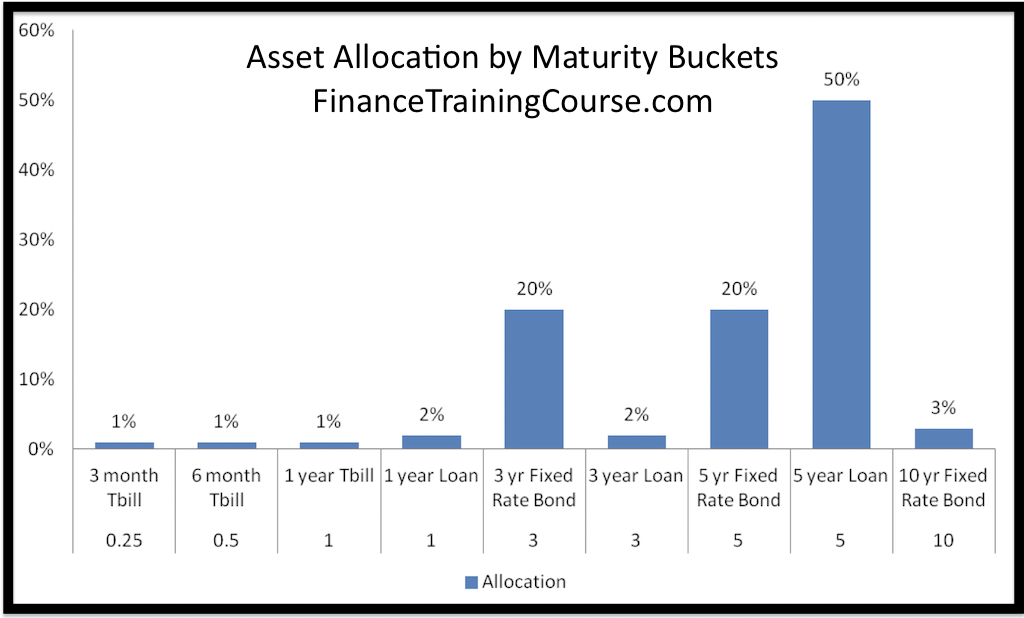
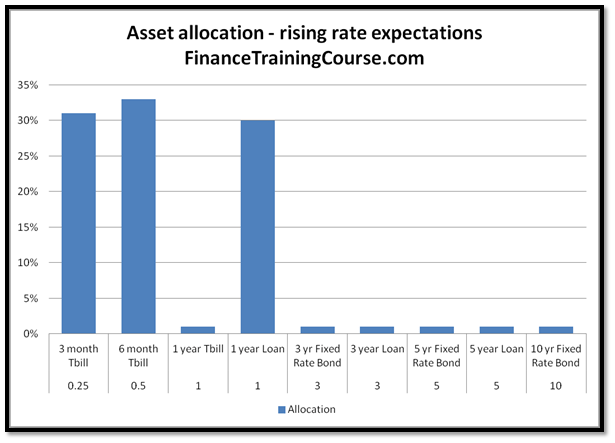
We use nine asset classes ranging from maturities of 3 months to 10 years in our template. The stylized presentation marks each bucket with the relevant balance sheet percentage allocation.

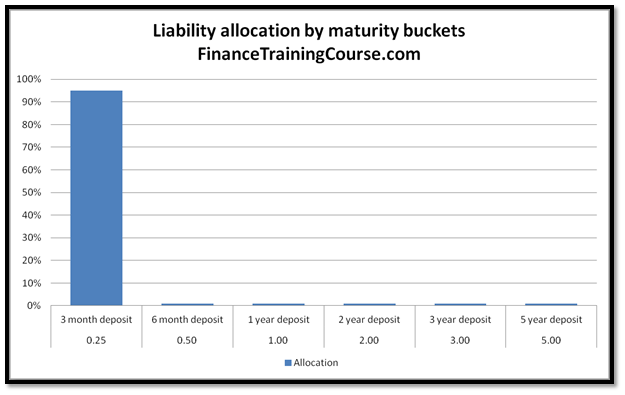
We will use the same template for the distribution of liabilities. The only difference is that we use six different liability classes with maturities spread between 3 months to 5 years.
Using the stylized ALM template to illustrate ALM Strategies
How do we put the template to work? Here is an initial list of questions that we would like to answer:
a) How do varying maturity distributions across assets and liabilities change shareholder value?
b) How does changing the same distribution impact future earnings?
c) Is there an ideal fit (distribution) that a client bank aims to achieve for an interest rate outlook? It would be interesting to examine how our allocation strategy would change based on our view of the interest rate environment.
ALM Strategies – Is there an ideal ALM maturity distribution for a given interest rate scenario?
We start with the last question first. If you know interest rates are going to rise, how would you change the maturity distribution of assets and liabilities? If you know interest rates were going to fall, what would you change, what would your ALM strategy be?
Bank ALM Scenarios – Interest rates expected to rise.
Impact on liabilities
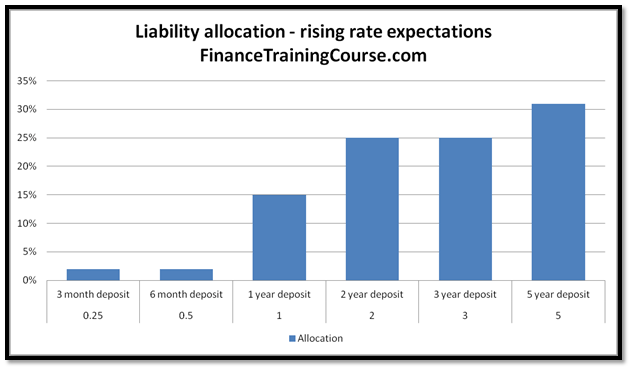
If we expect rates to rise, the standard response is to extend the maturity of liabilities so that the cost of deposits locks in for a longer duration of time using current (low) rates. Historically, the focus and concentration of bank borrowings is the shorter tenors. The maturity extension ALM strategy would focus on approaches and incentives that would allow deposits to be locked in at fixed rates for a significantly longer period of time.
Once we lock in ourselves and rates rise a new question arises. If we managed to do a mark to market at the fair value of liabilities, at the new rates, there should be a mark to market gain (loss) on the liability account. Even though regulatory frameworks do not allow us to mark down deposits to reflect interest rate changes, there is certainly an opportunity cost gain by paying lower than the average market rate for deposits.
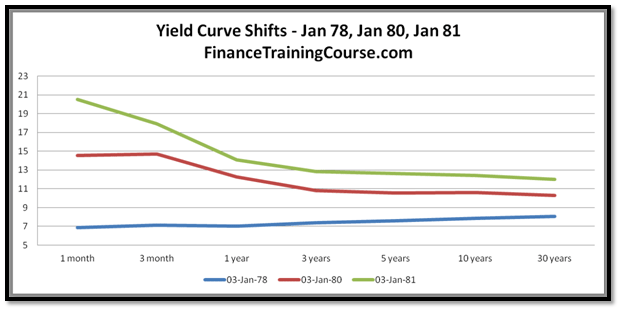
Between 1978 and 1981, short term interest rates in the US rose from 7% all the way up to 21%. Longer term rates (yields on 10 year bonds) did not rise by as much but still moved from 7% to just under 13%. If in 1978 we had access to an interest rate oracle, our original deposit profile would shift from the figure below to the figure that follows immediately after.

While a perfect fit would be to move all deposits to the 5 year bucket, realistically speaking that is not possible. Truly long term deposits are difficult to close and retain. Which is the reason why we end with a more gradual laddered maturity profile for longer term deposits.
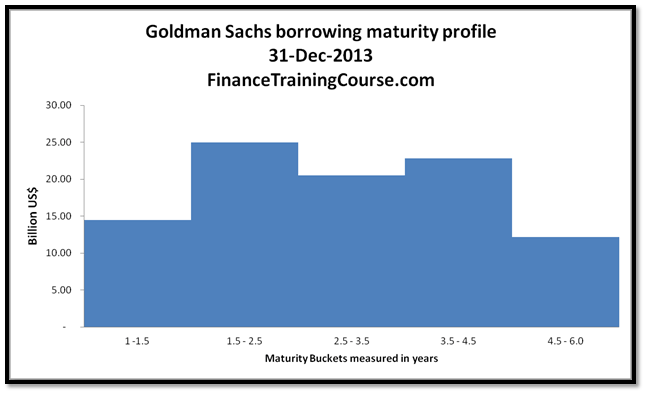
Goldman Sachs Example
Sounds a little dated and unreal. Here is a snapshot from Goldman Sach’s published financial statements as at 31 December 2013.
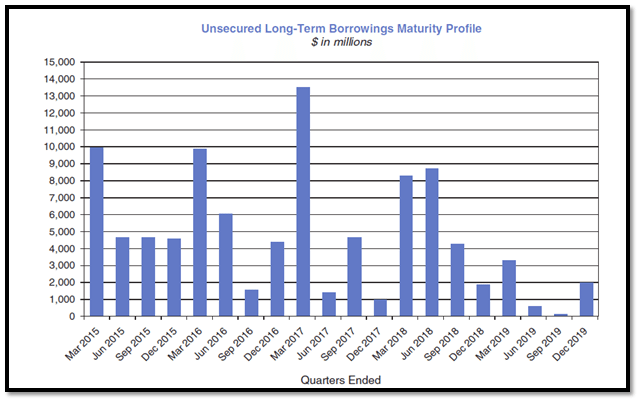
If you can’t see the trend in the graph above, we present the same information in our stylized template for easier comparison. The market certainly expects rates to rise and Goldman is no exception.
Impact on assets
At the same time on the asset front, rising rates will lead to a mark to market (MTM) loss on fixed rates assets. We should see a very different maturity profile. Asset maturities should shrink across the board with the largest chunk bucketed in the short term maturity buckets.
This is easier said than done. Restructuring asset maturities on a bank balance sheet over a six month to a yearlong window tends to be difficult. It is like making a supertanker (VLCC) take a u-turn in the middle of the Atlantic ocean.
Liquidity is an issue with long duration investments as well as with term loans. While as a bank we would love to switch maturity buckets at our whim 10, 15, 20 and 30 year bonds are significantly less liquid than treasury bills. Large positions take time to liquidate but they are still easier to switch than the advances portfolio. 5 year term loans cannot be called and refinanced within a few months. Even working capital and running finance lines need to be rolled over a few years in adjustment mode before they are paid down in full by clients.
Restructuring a fresh balance sheet is easier. Alternatively, if you have been hoarding cash by restricting credit as reflected by your advances to deposit ratio, that too can work in your favor. But the decision to restrict credit and the implementation of this decision across your lending network can only be executed over a multiyear time frame. As clients pay down balances on loans, the freed up cash is not reinvested within the lending balance sheet but parked in liquid assets for future redeployment. When rate expectations are finally realized these liquid reserves are deployed at the new higher rates.
It is possible that by the time your transition to your idealized balance sheet profile is completed, the interest rate outlook changes again, requiring you to redo your asset allocation all over again.
Bank ALM scenarios – Interest rates expected to decline.
How does your strategy change if you expect interest rates to decline. Between 1982 and 1986 rates slowly gave up their gains and fell all the way down to 7% from their recent peaks touched in the early ’80s.
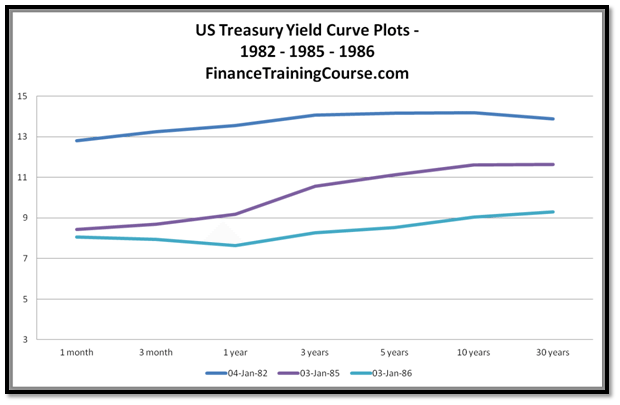
Our approach to assets and liabilities reverses. We shorten our maturity exposure for liabilities and extend it for assets. Declining rates will lead to capital gains on investment securities. On the advances portfolio, we would like to lock in longer dated loans at current high interest rates.
Compared to our earlier challenges with extending maturities, shortening maturities is relatively easier on the deposit side.
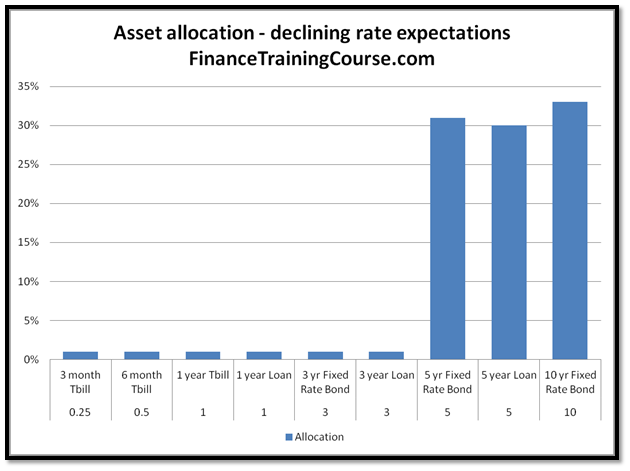
For a fully deployed balance sheet restructuring the advances portfolio, however, is still a challenge.
Bank ALM scenarios – Uncertain interest rate outlook?
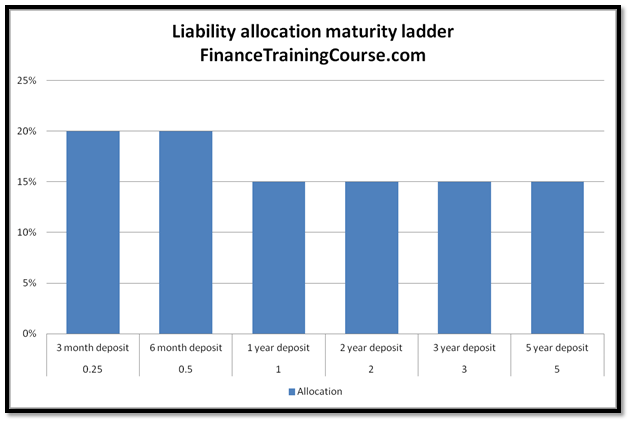
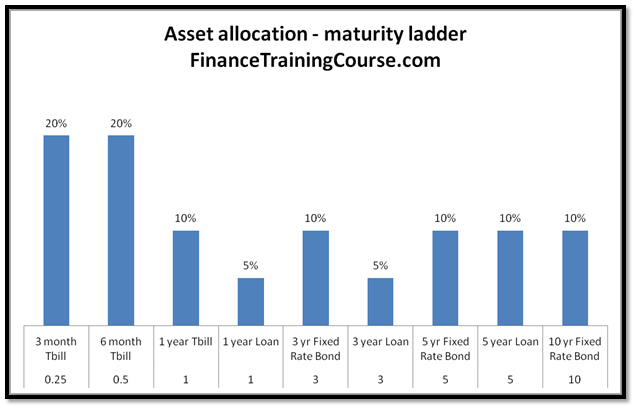
When we are not sure about the direction of the interest rates, the best approach is to hedge our bets by using maturity ladders. A maturity ladder aims to distribute exposure evenly across maturity buckets. For liabilities as well as assets.
On the liability front, this implies a decision to distribute deposits across maturity buckets. There is still a bias towards short term deposits because they are relatively easier to book.
On the asset front, this leads to an attempt for an even distribution across asset maturity buckets. However given the uncertain outlook, there may be a preference towards investment securities rather than lending since securities are easier to liquidate and re-allocate than loans.
More questions on ALM strategies?
What happens if we don’t follow the standardized templates for rising or declining rate environments? Or if we flip and switch one of the above recommended profiles with alternates? Or if we successfully manage to reposition our balance sheet but the interest rate outlook fails to oblige and goes in the opposite direction?
To answer these questions we need to take a closer look at the interaction of interest rate changes and maturity profiles with value and income. It’s a topic that we will cover in greater detail in our future posts on asset liability management.