We revisit the optimal portfolio alpha allocation challenge. What is the right approach for allocating portfolio alpha? Maximizing alpha, minimizing alpha or somewhere in between? Is there a viable alternate approach that can make money with portfolio alpha estimation and allocation in the real world?
In our previous post on portfolio alpha cyclicality and stability we introduced two new concepts. Baseline alpha and alpha deviations. Baseline alpha was defined as an average of the multiyear trend for security and portfolio alpha while alpha deviation was the difference between the most recent year alpha and the estimated baseline alpha value. The multiyear trend was developed by estimating individual alphas for each calendar year of data. We made one additional tweak in our alpha estimation which was using realized holding period return rather than estimated annualized expected return for our alpha calculations.
Working with a market based data set we examined the trend for changes in the value of alpha for specific securities and suggested that there may be an alternate portfolio allocation strategy that may outperform simple alpha maximization on a going forward basis.
If you remember our performance evaluation and allocation metrics looked back in most instances. We would allocate capital based on historical performance and then also evaluate performance on how well that allocation had done on a look back basis. However, when we evaluated portfolio performances on a forward looking basis sometimes our numbers didn’t shine as much.
Our alternate approach suggested that while we could use historical data to estimate alpha, baseline alpha and alpha deviations, for evaluation we could use a cutoff point in the future that did not exist in the original allocation data set. For instance, while we used an eight year look back period (Oct 2008-Oct-2016) to allocate positions for performance evaluation purposes we could use market prices as at 30th June 2017. The 30th June 2017 price set was not included in the original portfolio allocation data set.
Hence the term forward looking.
Rather than maximizing alpha, the alternate strategy would minimize alpha deviation – essentially maximizing the difference between the current year alpha and the historical trend for alpha for a given security. The idea being that a good year would be followed by a bad year; a bad year by a good year. As long as our security selection algorithm filtered the right securities, within our selected securities universe such an algorithm emphasizing cyclicality may outperform other conventional approaches.
By definition, such a strategy would over allocate in securities whose most recent year alpha (read: performance) is lower than the historical average versus securities whose most recent alpha is higher than the historical average. For instance, if the most recent year shows that Google had a really good current year when it came to alpha and Apple had a terrible year with respect to alpha the model would allocate more capital to Apple over Google using this logic.
The table and graph below show the estimates for both baseline alpha and alpha deviation for securities in our portfolio universe from 2009 to 2016.
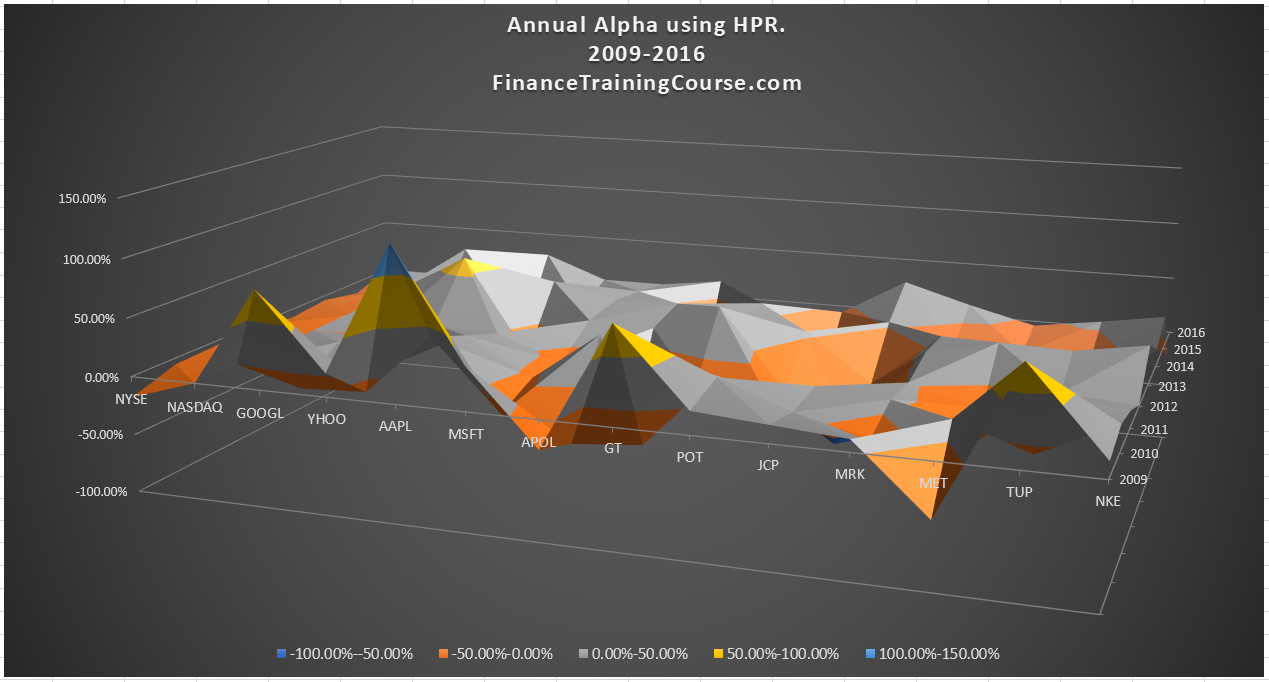
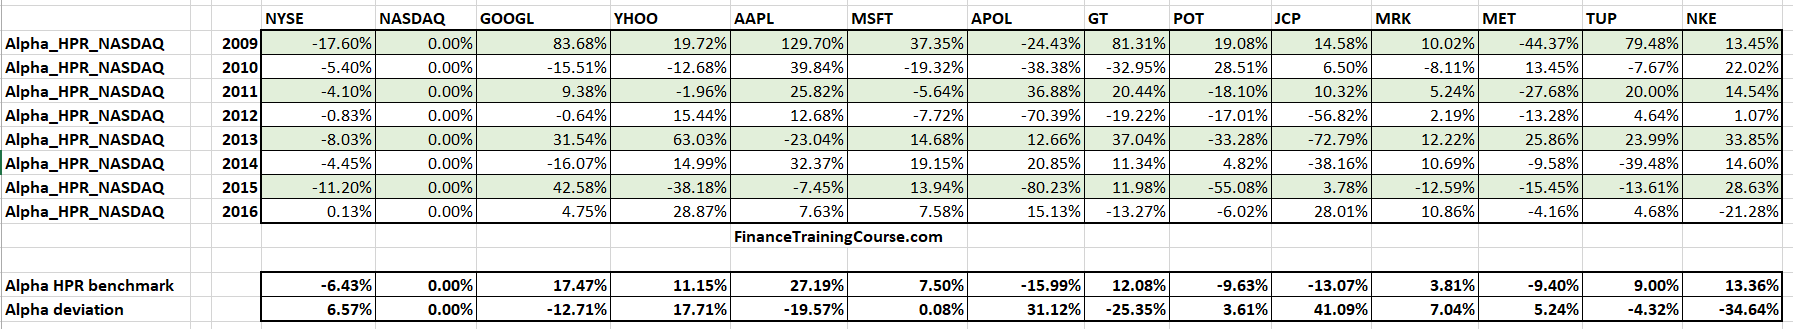
The alternate allocation strategy would favor those securities where alpha deviation is negative in the most recent years compared to securities where alpha deviation is positive. The model’s initial filter would highlight Google, Apple, Goodyear, Tupperware and Nike over other candidates in the securities universe because their most recent year alpha is significantly lower than their baseline (benchmark) alpha.
In this post, we present the results of a short case study that looks at the result of testing our assumptions. Working with the same securities universe we examine the performance of two portfolio allocation strategies. A default alpha maximization strategy – the strategy we have been following so far in our course on portfolio allocation and optimization versus our new alternate alpha deviation minimization strategy.
Alpha cyclicality as measured by alpha deviation – the assignment
To assess the difference between the two portfolio allocation models here are the steps that we have to take.
Step 1 – Allocate capital across equity securities in the universe in such a fashion that we maximize the most recent year Alpha (Jan-Oct 2016). Label this strategy – strategy A. Use Excel solver to optimize allocation and maximize portfolio Alpha. Calculate holding period return for this strategy for Jan-Oct 2016.
Step 2 – Allocate capital across equity securities in the universe in such a fashion that we minimize the most recent year (Jan-Oct 2016) Alpha deviation. Label this strategy – strategy B. Use Excel solver to optimize allocation and minimize portfolio Alpha deviation. Calculate holding period return for this strategy for Jan-Oct 2016.
Step 3 – For the two strategies – strategy A and strategy B calculate holding period returns (HPR) for the period 31 Oct 2016 – 30 June 2017 using the following prices.
Step 4 – How do the two strategies compare?
Optimal portfolio alpha allocation
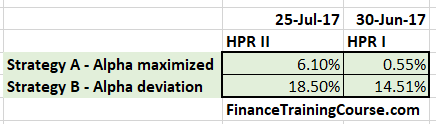
The results were not surprising. We defined two separate evaluation periods. The first one ended on 30th June 2017 and gave us HPR I. The second one finished on 25th July 2017 and generated HPR II. We used the second evaluation period to remove any biases that may have been introduced by the 30th June month end and quarter end effect on account of book closures at institutional investors and fund managers.
Both strategies were evaluated. The results are presented below.
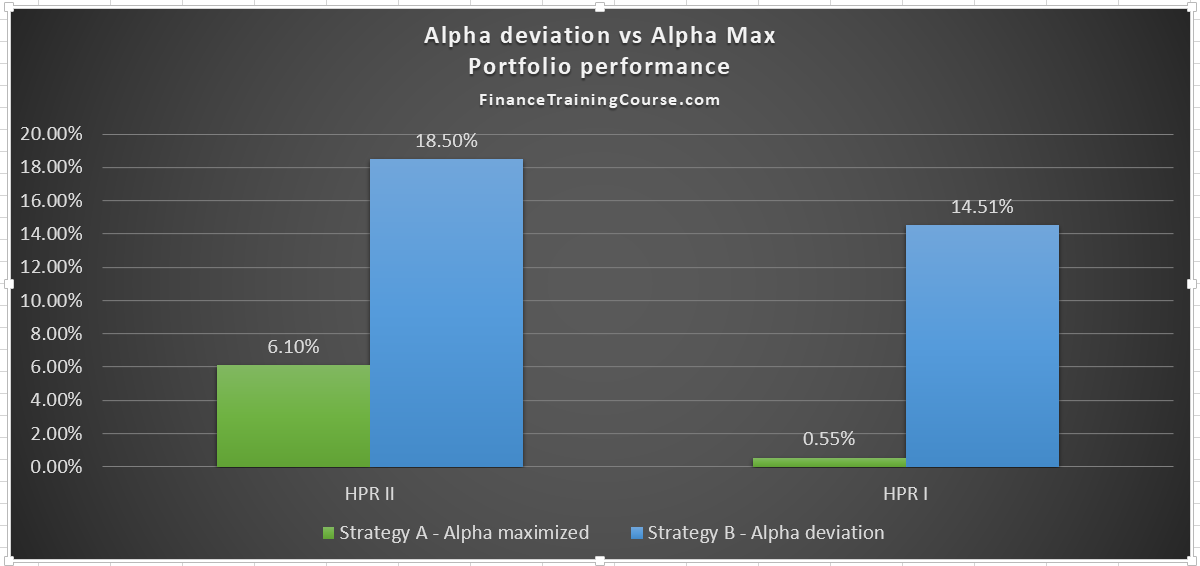
The alternate strategy using alpha deviation clearly dominates the original alpha maximization strategy across both evaluation periods. Ignoring HPR I for a second the alternate strategy generated 3 times as much returns compared to the original conventional approach of allocating portfolio alpha.
Here is the interesting thing. At the point of allocation (October 2016), Strategy B’s most recent year portfolio alpha is negative (-2.09%). Portfolio Alpha deviation for the same portfolio at the same point is -14.1%. More importantly, the holding period return as of calendar year 2016 using the look back evaluation method is only 1.9%. All three metrics while using a conventional approach would point towards sub-optimal future performance of the portfolio if we believed that historical performance is likely to be repeated in the future.
If we had stayed with the original allocation strategy this portfolio would have never made the cut.
The logic behind the allocation model is cyclicality and understanding that good years are followed by bad years followed by good years. The cyclicality phenomenon is well documented and has a strong following research and literature under the contrarian school/style of investing in the portfolio management world.
![]()
xProduct()