This is our second post in the TARF hedge effectiveness series and in the treasury candidates assessment series case. To catch up with the case please see the original TARF case study that defines the client requirement as well as available product universe. Also see for additional background structured FX products mis-selling.
To evaluate hedge effectiveness as well as relative attractiveness of multiple structures we have to start off with establishing a baseline for measuring performance. For us that baseline is driven by two specific scenarios.
- Leaving our exposures unhedged. What is the worst that can happen?
- Hedging our exposure with simple forward contracts. How does this compare with (a)
Once we have the answers to the two questions above, we have a baseline. The baseline can then be used to compare the results from all other structures in our product universe. A structure is attractive if it outperforms the baseline. A structure is unattractive if it under performs the baseline. So before we can actually build the model for TARF participating forward hedge effectiveness we need to run hedge effectiveness analysis for simpler products. Since the more exotic products in our universe also use the simpler products as building blocks we should be able to reuse this work later.
To repeat the question we want to ask:
Given the universe of exotic contracts available to a client, is he or she better off working with conventional, plain vanilla solutions or do exotic contracts have something to offer?
Step 1 – The un-hedged scenario
Our first step is to establish what is the worst that can happen without hedging? If we leave our exposure un-hedged what kind of fluctuations are we likely to see?
We define losses as the difference between the current spot price and the projected future spot price at the time of settlement. Since we are assuming 12 settlement, our exposure is spread over 12 separate monthly deliveries.
A second choice is to use the implied forward exchange rates. As long as we use the same consistent definition we should be all right.
A simple example should help clear potential confusion.
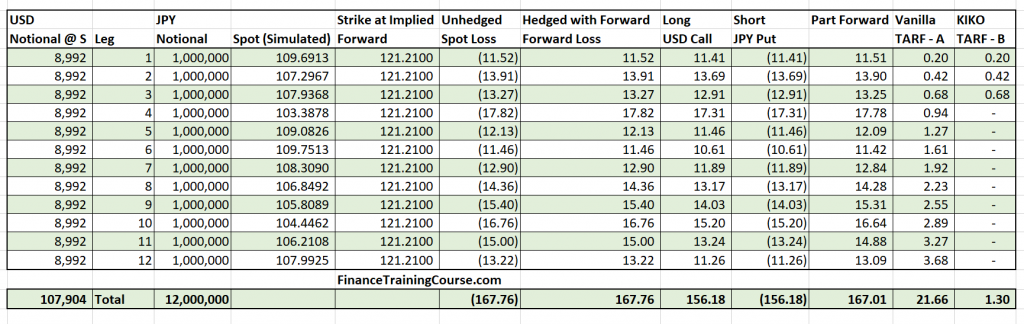
For our first leg, the client needs to buy JPY 1,000,000 one month down the road. The current exchange rate is 111.21. If he leave this exposure unhedged he will buy JPY 1,000,000 thirty days later at the then available exchange rate. If 30 days later the USD JPY exchange rate is 115.00 – the client is better off. Rather than paying USD 1,000,000/111.21 = (8,992) he will now only pay USD 1,000,000/115 = (8,696.65) to purchase the notional amount of JPY 1,000,000. If the exchange rate does fall to 115 we would save USD 296 by leaving the exposure open.
However if the exchange rate shifts to 105.00 the client will be worse off because he will now have to pay USD 1,000,000/105 = (9,523.81). If the exchange rates rises to 105 we would end up paying an additional USD 531.81 because of the change in rates.
This marginal shift in the USD amount (or the equivalent JPY amount) is the impact of leaving the exposure unhedged. If this was hedged with a forward contract, the marginal amount at the time of settlement thirty days later would be zero. Because we would have locked in the forward rate. To simulate this cost we need to simulate the exchange rate and calculate the difference using a given rate (the spot rate or the implied forward rate) on the original date.
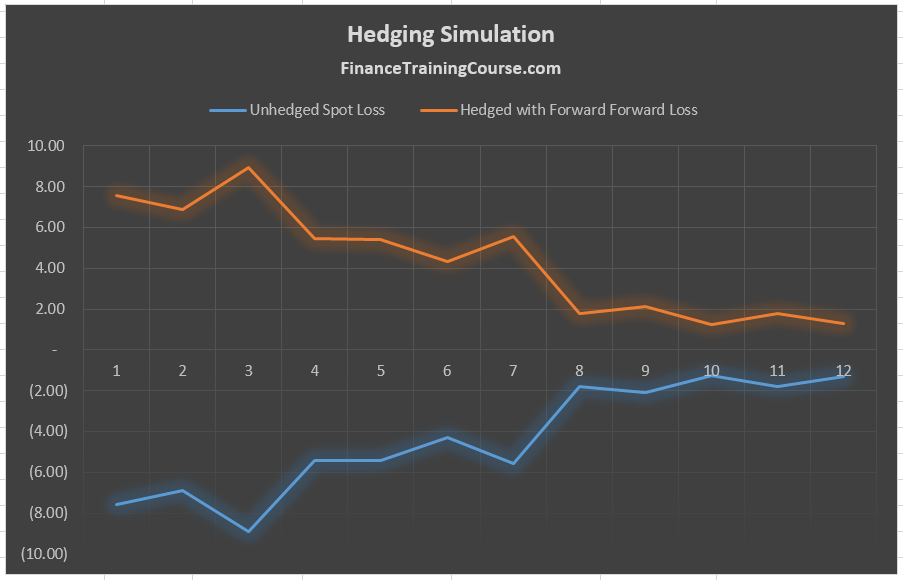
Step 2 – The hedged with forward scenario
If the forward contract hedges correctly then our original exposure to price changes should come down to zero or close to zero. Which means that the saving from the forward contract will be the exact mirror image of our losses from our un-hedged spot exposure. The two choices we have are picking
Step 3 – The hedged with vanilla options and exotic structures scenario
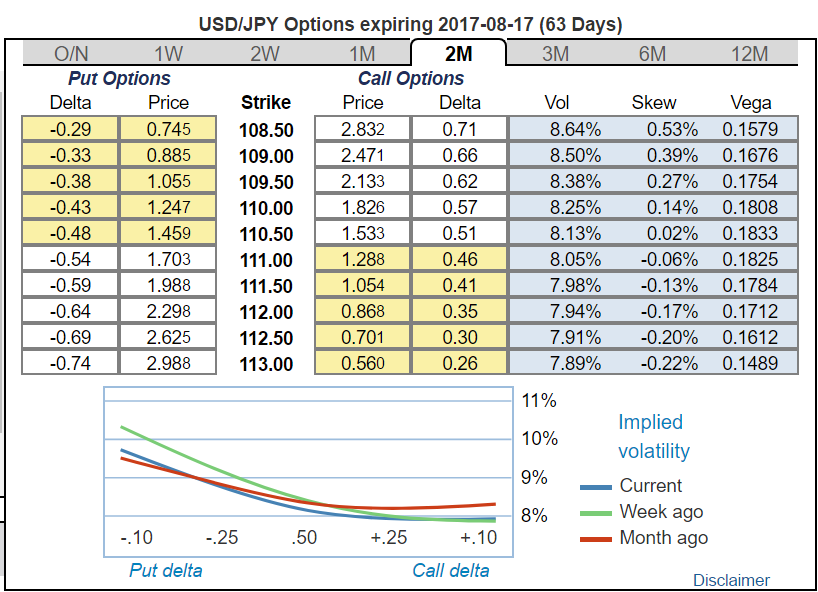
Similar to the forward contract the hedged with vanilla option scenario would require us to simulate the payoff for a given option. However since the option involves a premium, its cost would need to be included in calculating the net impact on our hedging requirement. This means that we need to simulate the payoff from all the products in our product universe (vanilla calls and puts, participating forwards, vanilla TARF and KIKO TARF – KnockIn KnockOut).
To make things simpler it generally helps to price the vanilla products first and calibrate their pricing using market prices of basic instruments. You can use any market based source of option prices to calibrate and fine tune the model.
Once the model matches market prices, you can add complexity by adding participating forwards as well as the two different TARF variations included in the structured product universe.
The performance metrics
Side by side with measuring hedge effectiveness we are interested in two new metrics.
- Net Savings. How much does the structure save us in JPY/USD terms? So compared to the original spot rate when we use the structure to hedge our exposure what is our actual cost or savings expressed as a percentage of the original exposure. For instance if the original exposure was JPY 12 million and the impact of the structure was a positive JPY 6 million, the Impact/Exposure metric would be 6/12 or 50%. We calculate this figure as an average of all iterations from our simulation model.
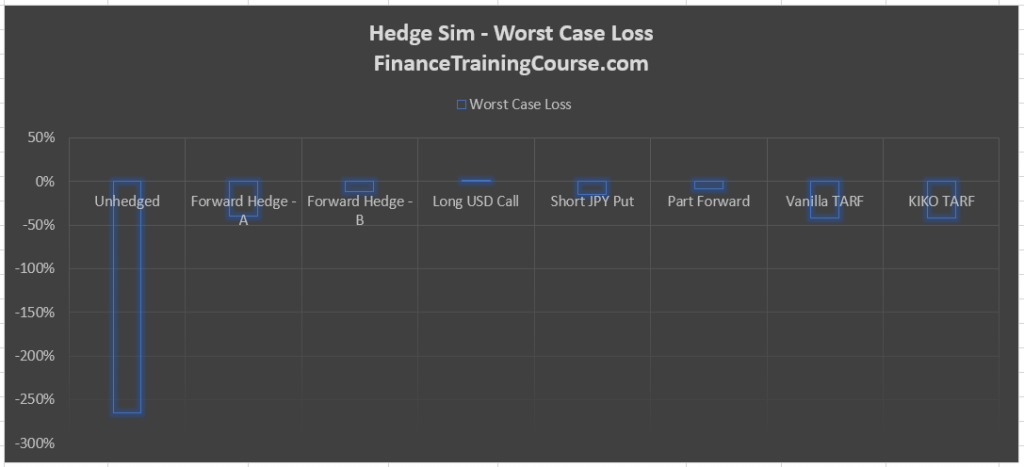
- The downside. What is the worst case downside for the structure expressed as a percentage of original notional? Within our simulation results what is the worst case downside we would experience with a given structure. Expressed as a percentage of original notional. In your simulation results warehouse calculate the minimum value across all iterations for a given product to estimate the downside. Then divide it by the exposure figure to express it as a percentage.
Building the model
To build the model in Excel you would need to simulate each leg in the structure for each exotic product available in your universe or required for the comparison exercise. The sequence of steps are:
- Simulate the underlying FX exchange rate using Monte Carlo simulation.
- Simulate the payoff for vanilla products including the simple forward, call and put options.
- Simulate the payoff for participating forward and TARF.
- Calculate average impact and worst case loss.
- Plot required graphs.
Remember you have to use all available data for each leg. Which means that you will use the applicable interest rates for the applicable tenors, the applicable strikes (implied forward rates or off market rates depending on whether this is or is not a zero cost structure), and the applicable implied volatility values for each leg.
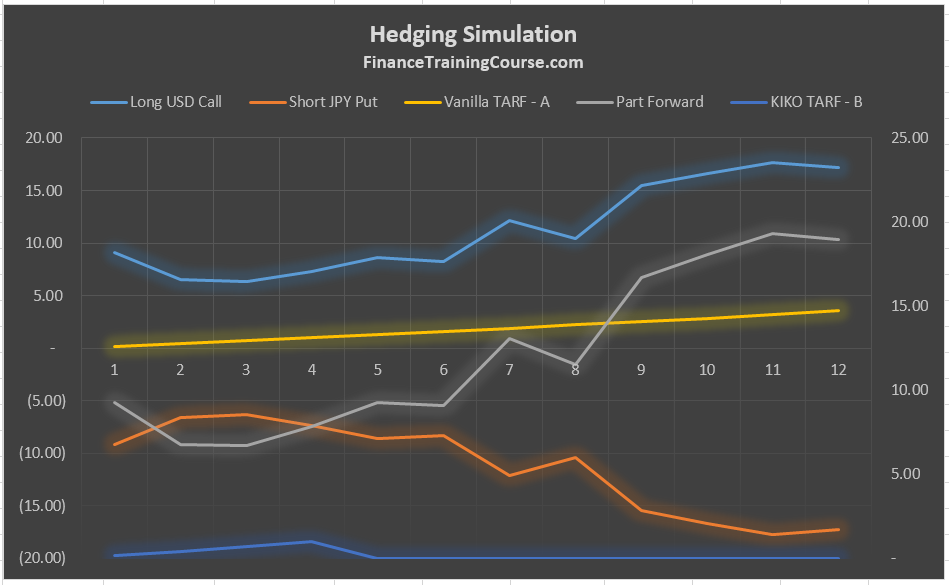
Making the call.
Remember what do we expect to achieve from this exercise. We want a crude comparison across products using a simple simulation model so that we can recommend the right structure to our client. If our model produces the graphs that you see below what does that indicate about the performance of our product universe. Which one of these securities would you like to recommend to our client?
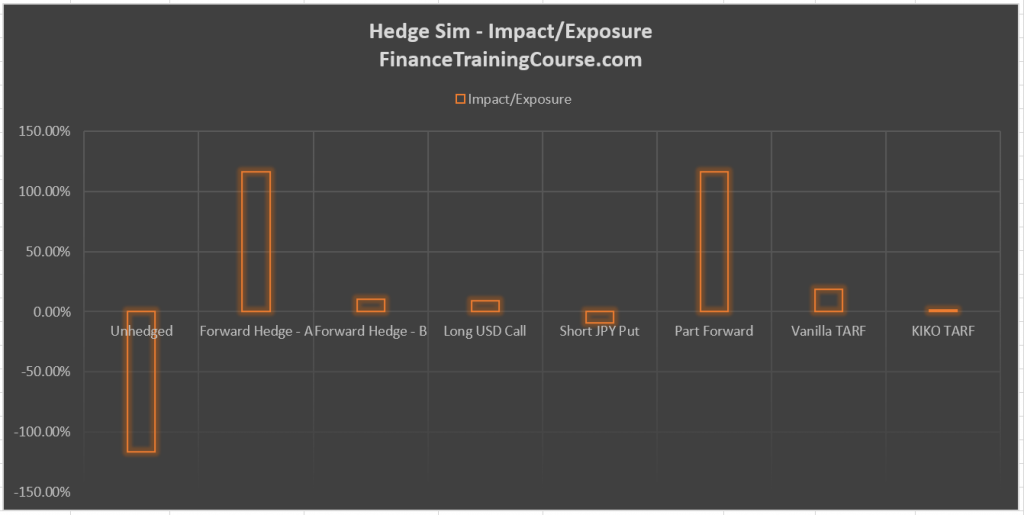
Client preferences vary. If a client is interested in limiting potential downside especially under extreme unanticipated events – the worst case loss metric is the right metric to look at. If the client is looking at hedge effectiveness and efficiency then impact over exposure is the right metric. For most clients the driver would be some combination of both metrics.
Are there any metrics that you can design that would be relevant and of interest to a client? Do zero cost structure really make sense in view of the above results. What do the above graphs indicate about TARF hedge effectiveness when compared to other simpler and non-zero cost products?