Market Analysis
Weather
- North West Europe: Weather remained cold this week, and a bit mild outlook for next week, though no consequences on demand for heating.
- South West Europe: Cold weather in France, whereas mild weather in Italy, Spain and Portugal.
- South America: Still warm weather with same outlook for next week.
- Middle East: Mild weather in Middle East and with same outlook for next week.
- South Asia: Winter in full swing in India and Pakistan.
- North East Asia: Except for Taiwan, which is in mild weather, winter in full swing in Japan, Korea and China.
- South East Asia: Still enjoying warm weather.
- North America: Mexico in mild weather, whereas in US other than South West and South East, there is cold weather outlook but still above than seasonal norms.
Crude Oil
- Crude oil prices remained mixed, mostly bullish due to Forties pipeline outage issue, however middle of week price went down as there were profit taking plus more than expected gasoline inventory, however price remained bullish on North Sea outage issue.
- Brent prices closed on $63.23/BBL on Friday, while WTI closed at $57.30/BBL.
- Brent and WTI future in short and long term are in backwardation, translating into investors’ confidence on OPEC production cut and demand/supply balance in long term.
- Future market closure on Friday for Brent at $63.24/BBL, $62.69/BBL & $62.33/BBL for Feb., Mar. & Apr. contracts depicting backwardation, whereas WTI futures closed at $57.36/BBL, $57.39/BBL & $57.29/BBL for January, February & March 2018, depicting backwardation and emphasizing supply balancing.
- Baker Hughes rig count reported an increase by 4 to 747, however production is still on the rise.
- Brent-WTI spread remained started at $6.70 and closed at $5.93/BBL on Friday.
- US crude Production, Export & Inventory data
| Million Barrels (MBbl) | 8-Dec-17 | 1-Dec-17 | 24-Nov-17 | 17-Nov-17 |
| Production (MBbl/D) | 9.780 | 9.707 | 9.682 | 9.658 |
| Exports (MBbl/D) | 1.086 | 1.358 | 1.412 | 1.591 |
| Crude Inventory | 443.0 | 448.1 | 453.7 | 457.1 |
| Gasoline Inventory | 226.5 | 220.9 | 214.1 | 210.5 |
- EIA Weekly report reported 5.1 million barrels draw down with stock at 443.0 million barrels on 8th December 2017, against a market expectation of 3.48million barrels draw down.
- Gasoline inventories at 226.5 million barrels reported on 8th December 2017, 5.7 million barrels build up against a market expectation of 2.5 million barrels buildup.
Natural Gas
- Henry Hub prices remained bearish primarily on warmer than normal weather outlook despite the bullish natural gas number from EIA, and closed at $2.612/MMBTU on Friday.
- Baker Hughes reported increase in gas rigs by 3 and total number stands at 183.
- EIA reported working gas in storage is 3,626 BCF as of Friday, 8th December 2017, net decrease of 69 BCF, with market expectation of 60 BCF decline.
- CME Henry Hub future on Friday closed at $2.622/MMBTU for January, $2.649/MMBTU for February and $2.622/MMBTU for March.
- North West European gas hub prices had a quite a roller coaster drive during the week due to Baumgarten blast, reduced Norwegian flow, cold weather outlook and rising crude and coal prices on Friday.
- As per GASCO data, pipeline gas flow reduced for Germany, Belgium, and UK on 12th December due issue at Troll, Valemon, Oseberg and Kollsnes, flows started resuming with average flows are given below;
BCFD
Germany
France
Belgium
UK
2nd – 8th December 2017
4.16
1.83
1.49
4.35
9th– 15th December 2017
3.43
1.67
1.35
4.36
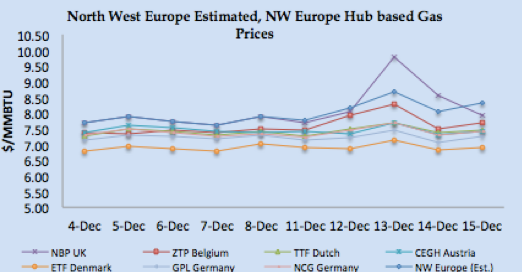
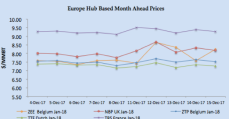
- NBP UK Spot price closed at 59.389 Pence/Thm ($7.91/MMBTU) on Friday, after jumping to 72.83 Pence/Thm on Wednesday, increased by 2.82% from last Friday.
- NBP UK Front month price closed at 61.40 Pence/Thm ($8.18/MMBTU) on Friday, depicting weather based bullish movement.
- TTF Day Ahead prices closed at €21.658/MWH (equivalent of $7.46/MMBTU) whereas front month price closed at €21.06/MWH ($7.25/MMBTU) on Friday.
- South West Europe prices followed NW European bullish run on same premises along with Italian prices surging on Austrian gas hub blast & low hydro based electricity generation in Spain.
- Spain hydro-based electricity generation deceased from 2.91 TWH to 2.79 TWH, down from peak of 8.24 TWH within 2017.
- Day Ahead PEG Nord closed at €22.363MWH ($7.70/MMBTU) on Friday, whereas TRS France at €24.155/MWH ($8.32 MMBTU), Italy at €22.949/MWH ($7.90/MMBTU) and Spain at €26.70/MWH ($9.20/MMBTU).
- PEG Nord front month closed at €21.870/MWH ($7.53/MMBTU), TRS at €26.977/MWH ($9.29/MMBTU) on Friday and Iberian prices at €28.000/MWH ($9.72/MMBTU) on Wednesday.
Weekly European Gas and LNG quantities at Storage and LNG terminals (BCF)
One standard size Vessel of 150,000 m3 equals to 3.42 BCF.
| Quantity in BCF | 15-Dec-17 | 8-Dec-17 | 1-Dec-17 | 27-Nov-17 | |
| Belgium | Gas | 25.40 | 23.88 | 20.94 | 17.40 |
| LNG | 2.48 | 4.48 | 3.81 | 3.15 | |
| Total | 27.88 | 28.36 | 24.75 | 20.55 | |
| Capacity Utilization | 72% | 73% | 64% | 53% | |
| France | Gas | 316.20 | 300.35 | 280.74 | 263.04 |
| LNG | 21.06 | 16.08 | 17.97 | 16.60 | |
| Total | 337.26 | 316.43 | 298.72 | 279.64 | |
| Capacity Utilization | 69% | 65% | 61% | 57% | |
| Germany | Gas | 686.09 | 654.92 | 624.31 | 581.66 |
| LNG | – | – | – | – | |
| Total | 686.09 | 654.92 | 624.31 | 581.66 | |
| Capacity Utilization | 86% | 82% | 79% | 73% | |
| Greece | Gas | – | – | – | – |
| LNG | 1.38 | 1.62 | 2.38 | 1.57 | |
| Total | 1.38 | 1.62 | 2.38 | 1.57 | |
| Capacity Utilization | 52% | 60% | 89% | 59% | |
| Italy | Gas | 596.72 | 579.92 | 552.93 | 530.59 |
| LNG | 5.34 | 4.78 | 2.76 | 3.10 | |
| Total | 602.06 | 584.70 | 555.69 | 533.69 | |
| Capacity Utilization | 90% | 87% | 83% | 80% | |
| Lithuania | Gas | – | – | – | – |
| LNG | 1.83 | 1.44 | 1.05 | 0.64 | |
| Total | 1.83 | 1.44 | 1.05 | 0.64 | |
| Capacity Utilization | 53% | 42% | 31% | 19% | |
| Netherlands | Gas | 393.09 | 374.27 | 351.40 | 324.31 |
| LNG | 9.14 | 6.16 | 5.89 | 5.64 | |
| Total | 402.23 | 380.43 | 357.29 | 329.94 | |
| Capacity Utilization | 88% | 84% | 79% | 73% | |
| Poland | Gas | 104.26 | 100.59 | 97.05 | 93.55 |
| LNG | – | – | 2.29 | 1.58 | |
| Total | 104.26 | 100.59 | 99.34 | 95.13 | |
| Capacity Utilization | 87% | 84% | 83% | 79% | |
| Portugal | Gas | 6.48 | 6.63 | 6.59 | 5.98 |
| LNG | 2.13 | 4.26 | 4.86 | 2.98 | |
| Total | 8.61 | 10.89 | 11.45 | 8.95 | |
| Capacity Utilization | 43% | 54% | 57% | 44% | |
| Spain | Gas | 83.00 | 81.76 | 79.36 | 76.77 |
| LNG | 32.01 | 36.67 | 32.97 | 32.51 | |
| Total | 115.01 | 118.43 | 112.33 | 109.28 | |
| Capacity Utilization | 65% | 67% | 64% | 62% | |
| UK | Gas | 29.43 | 24.80 | 28.21 | 15.86 |
| LNG | 22.32 | 22.65 | 24.96 | 27.62 | |
| Total | 51.75 | 47.46 | 53.18 | 43.48 | |
| Capacity Utilization | 77% | 71% | 79% | 65% | |
LNG Price Assessment and Natural Gas 4th – 15th December 2017
 |
 |
 |
 |
 |
 |
LNG Analysis
- European gas hub prices along with Chinese appetite and cold weather North East Asia, kept price momentum northward.
- There are news of China getting diverted cargoes due to cold weather and limited storage capacity, as one cargo was delivered from Japan and another cargo diverted from Brazil for China.
- On the supply side there has been tight situation as not much is available for January delivery now, however we expect ample supply after Australian liquefaction plant come back from turn around.
- There are spot cargoes available from Angola and Oman for end December and mid January 2018 loading.
- During 1st -15th December period US export volume grew from 0.565 MMT in 2016 to 1.45 MMT in 2017 and Australia from 1.43 MMT in 2014 to 2.83 MMT in 2017.
- India imported 1.25 MMT from 1st -16th December, while Pakistan received 0.20 MMT for the same period.
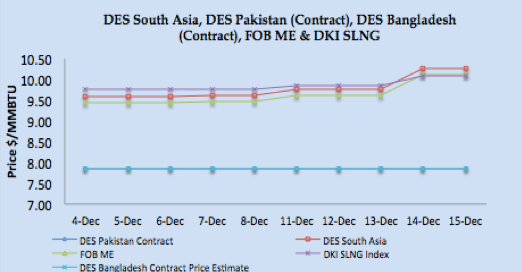
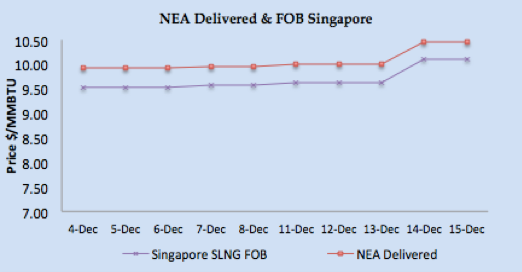
- Asian price closures on Friday; SLNG NEA Delivered at $10.46/MMBTU and FOB Singapore at $10.11/MMBTU.
- Based upon FOB Singapore and Middle East, DES South Asia is calculated around $10.26/MMBTU level. DKI SLNG Index on Friday reported at $10.07/MMBTU.
- JKM Future curve market remained stable with front month (February) at $10.45/MMBTU along with $9.30/MMBTU & $7.475/MMBTU for March & April 2018 respectively, depicting winter based demand peak in February. .
- Japan 26, China 19, Korea 18 and Taiwan 4 vessels during the week, MTD number as on 16th December stands at Japan 3.84 MMT (63 vessels), China 2.85 MMT (33 vessels), Korea 2.073 MMT (32 vessels) & Taiwan 0.758 MMT (9 vessels).
- China surpassing Korea and now have become second largest importer of LNG, China received one reload cargo from Japan.
- North West European LNG prices remained bullish on cold weather, disruption, low inventory level in UK along with rising coal and crude prices.
- North West Europe closed at around $8.33/MMBTU, inline with NBP UK January prices.
- South West Europe LNG also bullish due to price spike in Italy gas market along with demand from Spain and France.
- Based upon Iberian Peninsula gas hub price, PEG Nord, TRS and PSV along with Asian prices, South Western Europe prices are estimated in the range of $9.30/MMBTU.
- Portugal, Italy, UK, Belgium, Spain and France received total of 13 cargoes, 5 cargoes for Spain, 4 for France, one each by rest, while Turkey received 4 vessels.
- At the time of writing the report, next one week vessel arrival numbers are; Japan 31, China 7, Korea 8, Taiwan 4, India 3, and Italy & Singapore 2 each, which one for Portugal, Chile, Brazil and UK.
- Due to increase in Asian prices, arbitrage window still open for cargoes from NW Europe to Asia, as netback price is estimated to be around $8.51, whereas for SW Europe the window is closed now, as netback is coming around $8.71/MMBTU level.
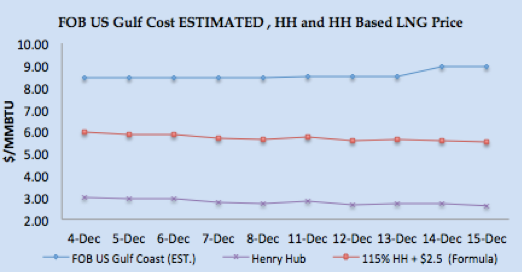
- US Gulf Coast producer price on FOB basis for January delivery for Asian destination comes around $8.96/MMBTU level, for NW European destinations the netback comes around $7.78/MMBTU level and for SW Europe its around $8.74/MMBTU.
- US Henry Hub based price is coming around $5.50/MMBTU for US based liquefaction companies, which translate into margin of $3.45/MMBTU for Asian destination, $2.28/MMBTU for NW Europe and $3.24/MMBTU for SW Europe.
- Current NEA price of $10.458/MMBTU level is estimated to be 17.80% of Brent 3-0-1 basis.
Author’s Comments
- This week crude oil price remained bullish due to Forties issue and that will keep the pressure up till the resolution of pipeline outage issue, however increased US production number diluting OPEC production cut. Important dimension need to seen acceptance of US crude as there are issues in quality which may result in widening the spread between Brent and WTI. Bullish crude price is currently supporting LNG price northward movement.
- Natural gas prices in Europe jumped on supply constraint but stabilized, however based upon Norwegian gas flow issue along with cold weather outlook, European gas prices provided support to Asian LNG prices during the week.
- LNG price had a bullish run primarily on European gas prices along with Chinese demand, however situation seem stabilized in European gas market, if there is no unplanned event we believe prices to remain at the same level or perhaps will opt for some correction, as the demand for spot is heard only from China and India is not ready to procure LNG at this price.
LNG Trade Flows (9th – 16th December 2017)
LNG merchant data is developed in collaboration with Clipper Data LLC, due to Thanks Giving holidays, 24th November data will be shared with next week report)
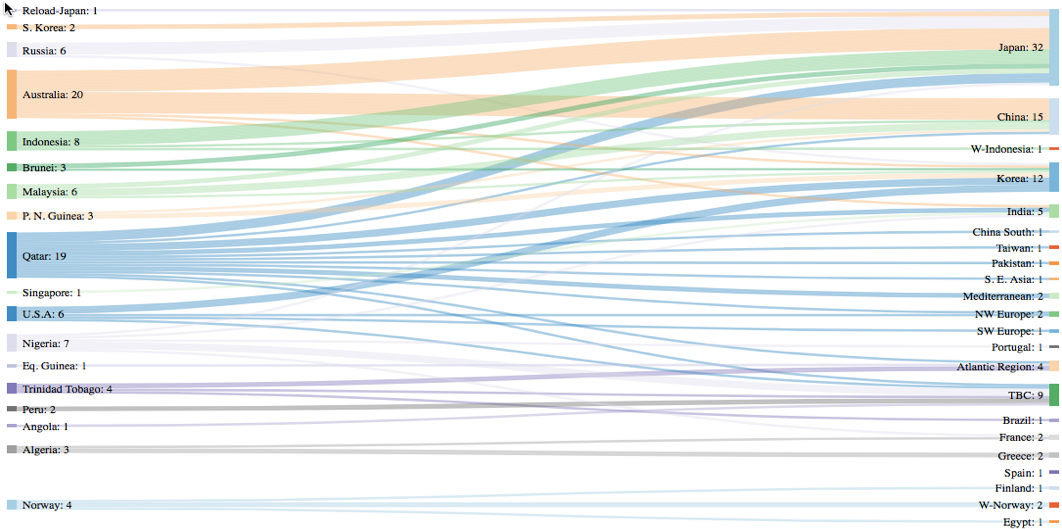
SUPPLY – TRADE FLOWS
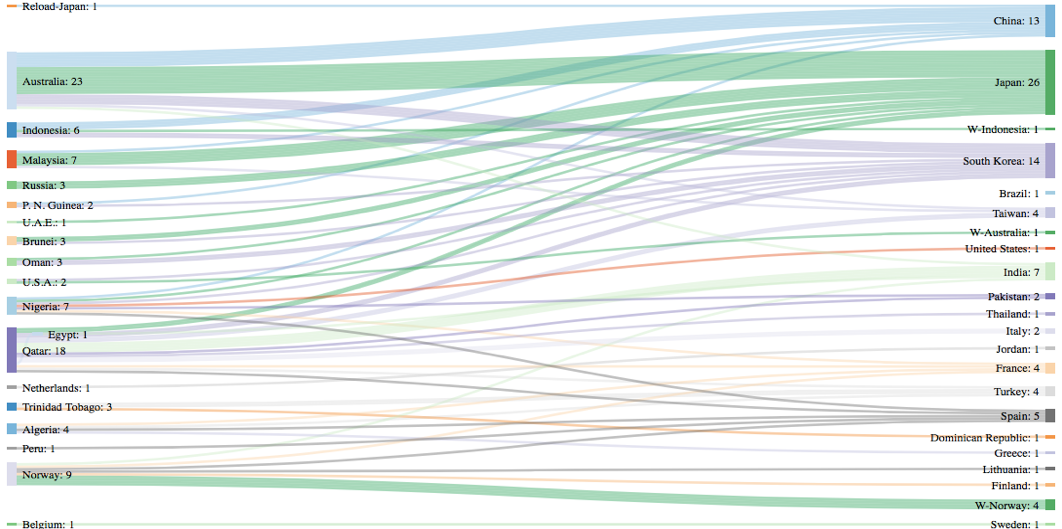
DEMAND – TRADE FLOWS
W-Country- within same country delivery & TBC – To Be Communicated
- 98 vessels carrying 6.60 million tons (317.10 BCF) loaded during the week.
- 107 vessels carrying 6.79 million tons (326.20 BCF) discharged at various demand centres during same time period.
Disclaimer: This is a personal analysis based on public information and should not be used for buying and selling of commodities. Source: SGX LNG Index Group, EIA, GIE, and Reuters.