Market Analysis
Weather
- North West Europe: Weather is remained mild and outlook is mild.
- South West Europe: Mild weather with same outlook for next week.
- South America: Warm with same outlook.
- Middle East: Mild weather prevailing in Middle East.
- South Asia: Winter in full swing in India and Pakistan.
- North East Asia: Except for Taiwan, which is in mild weather, winter in full swing in Japan, Korea and China.
- South East Asia: Still enjoying warm weather.
- North America: Mexico in mild weather, cold weather prevailed in US except South West and South East, and same outlook for next week.
Crude Oil
- Crude oil remained bullish from the start of the week due to short lived labor strike in Nigeria, along with Forties pipeline issue along with statements from Saudi Arabia and Russia on supply/demand balancing by 2H 2018.
- Brent prices closed on $65.11/BBL on Friday, while WTI closed at $58.47/BBL.
- Future market closure on Friday for Brent at $65.07/BBL, $64.58/BBL & $64.18/BBL for Feb., Mar. & Apr. contracts, whereas WTI futures closed at $58.35/BBL, $58.45/BBL & $58.48/BBL for January, February & March 2018.
- Both Brent & WTI future in backwardation, depicting impact on Forties pipeline and confidence on OPEC production cut.
- Baker Hughes oil-rig count reported no change and number stayed at 747.
- Brent-WTI spread remained strong and closed at closed at $6.64/BBL on Friday.
- US crude Production, Export & Inventory data;
| Million Barrels (MBbl) | 15-Dec-17 | 8-Dec-17 | 1-Dec-17 | 24-Nov-17 |
| Production (MBbl/D) | 9.789 | 9.780 | 9.707 | 9.682 |
| Exports (MBbl/D) | 1.858 | 1.086 | 1.358 | 1.412 |
| Crude Inventory | 436.5 | 443.0 | 448.1 | 453.7 |
| Gasoline Inventory | 227.8 | 226.5 | 220.9 | 214.1 |
- EIA Weekly report reported 6.5 million barrels draw down with stock at 436.5 million barrels on 15th December 2017, against a market expectation of 3.8million barrels draw down.
- Gasoline inventories at 227.8 million barrels reported on 15th December 2017, 1.2 million barrels build up against a market expectation of 1.9 million barrels buildup.
Natural Gas
- Henry Hub prices started bullish and ended bullish with some bearish tinge during the week, the bullish run is attributed to cold weather and colder outlook for most of US.
- Baker Hughes reported increase in gas rigs by 1 and total number stands at 184.
- EIA reported working gas in storage is 3,444 BCF as of Friday, 15th December 2017, net decrease of 182 BCF, with market expectation of 170 BCF decline.
- CME Henry Hub future on Friday closed at $2.681/MMBTU for January, $2.674/MMBTU for February and $2.636/MMBTU for March, depicting strength in the prices.
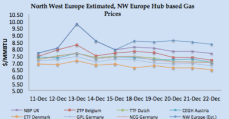
- North West European gas hub has a bearish run on warm weather outlook, start of holidays along with improved flow from Norway despite bullish crude prices.
- As per GASCO data, pipeline gas flow reduced for Germany for couple of day due to condensate issue at Valemon, overall flows improved from last week with average flows are given below;
| BCFD | Germany | France | Belgium | UK |
| 9th– 15th December 2017 | 3.43 | 1.67 | 1.35 | 4.36 |
| 16th– 22nd December 2017 | 3.78 | 1.78 | 1.55 | 4.76 |
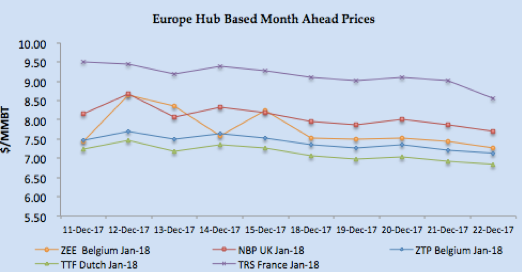
- NBP UK Spot price closed at 57.358 Pence/Thm ($7.66/MMBTU) on Friday, decreased by 3.42% from last Friday.
- NBP UK Front month price closed at 57.679 Pence/Thm ($7.70/MMBTU) on Friday, depicting weather based bullish movement.
- TTF Day Ahead prices closed at €20.243/MWH (equivalent of $7.04/MMBTU) whereas front month price closed at €19.69/MWH ($6.85/MMBTU) on Friday.
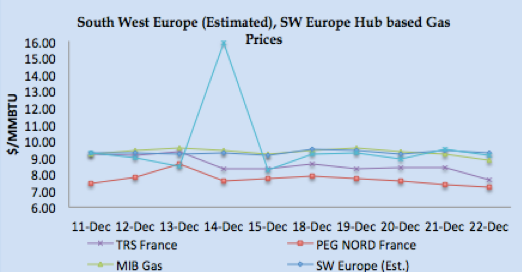
- South West Europe prices had a bearish run on weather, enhanced nuclear based electricity production in France and improved Hydro based electricity in Spain.
- Spain hydro-based electricity generation increased from last week 4.46 TWH to 4.77 TWH, however reduced number from last year 7.51 TWH.
- Improved nuclear power generation in France, 8% increase from last Friday, which has resulted in price plunging specially in Southern France.
- Day Ahead PEG Nord closed at €20.640MWH ($7.18/MMBTU) on Friday, whereas TRS France at €21.90/MWH ($7.61 MMBTU), Italy at €26.310/MWH ($9.15/MMBTU) and Spain at €25.30/MWH ($8.80/MMBTU).
- PEG Nord front month closed at €20.590/MWH ($7.16/MMBTU), TRS at €24.600/MWH ($8.55/MMBTU) on Friday and Iberian prices at €26.600/MWH ($9.25/MMBTU) on Wednesday.
- Weekly gas & Inventory level depicting winter based consumption; UK hasn’t received any LNG cargo during the week.
Weekly European Gas and LNG quantities at Storage and LNG terminals (BCF)
One standard size Vessel of 150,000 m3 equals to 3.42 BCF.
| Quantity in BCF | 21-Dec-17 | 15-Dec-1 | 8-Dec-17 | 1-Dec-17 | |
| Belgium | Gas | 14.15 | 17.40 | 20.94 | 23.88 |
| LNG | 2.67 | 3.15 | 3.81 | 4.48 | |
| Total | 16.83 | 20.55 | 24.75 | 28.36 | |
| Capacity Utilization | 44% | 53% | 64% | 73% | |
| France | Gas | 248.43 | 263.04 | 280.74 | 300.35 |
| LNG | 18.09 | 16.60 | 17.97 | 16.08 | |
| Total | 266.53 | 279.64 | 298.72 | 316.43 | |
| Capacity Utilization | 55% | 57% | 61% | 65% | |
| Germany | Gas | 542.79 | 581.66 | 624.31 | 654.92 |
| LNG | – | – | – | – | |
| Total | 542.79 | 581.66 | 624.31 | 654.92 | |
| Capacity Utilization | 68% | 73% | 79% | 82% | |
| Greece | Gas | – | – | – | – |
| LNG | 1.36 | 2.68 | 2.38 | 1.62 | |
| Total | 1.36 | 2.68 | 2.38 | 1.62 | |
| Capacity Utilization | 51% | 100% | 89% | 60% | |
| Italy | Gas | 506.20 | 530.59 | 552.93 | 579.92 |
| LNG | 3.53 | 3.85 | 2.76 | 4.78 | |
| Total | 509.73 | 534.44 | 555.69 | 584.70 | |
| Capacity Utilization | 76% | 80% | 83% | 87% | |
| Lithuania | Gas | – | – | – | – |
| LNG | 3.09 | 2.11 | 1.05 | 1.44 | |
| Total | 3.09 | 2.11 | 1.05 | 1.44 | |
| Capacity Utilization | 90% | 61% | 31% | 42% | |
| Netherlands | Gas | 302.31 | 324.31 | 351.40 | 374.27 |
| LNG | 5.49 | 5.64 | 5.89 | 6.16 | |
| Total | 307.80 | 329.94 | 357.29 | 380.43 | |
| Capacity Utilization | 68% | 73% | 79% | 84% | |
| Poland | Gas | 89.52 | 93.55 | 97.05 | 100.59 |
| LNG | 4.90 | 1.58 | 2.29 | – | |
| Total | 94.42 | 95.13 | 99.34 | 100.59 | |
| Capacity Utilization | 79% | 79% | 83% | 84% | |
| Portugal | Gas | 5.50 | 5.98 | 6.59 | 6.63 |
| LNG | 3.46 | 2.98 | 4.86 | 4.26 | |
| Total | 8.96 | 8.95 | 11.45 | 10.89 | |
| Capacity Utilization | 44% | 44% | 57% | 54% | |
| Spain | Gas | 75.58 | 76.77 | 79.36 | 81.76 |
| LNG | 30.29 | 30.86 | 32.97 | 36.67 | |
| Total | 105.87 | 107.63 | 112.33 | 118.43 | |
| Capacity Utilization | 60% | 61% | 64% | 67% | |
| UK | Gas | 12.84 | 15.86 | 28.21 | 24.80 |
| LNG | 25.88 | 27.62 | 24.96 | 22.65 | |
| Total | 38.72 | 43.48 | 53.18 | 47.46 | |
| Capacity Utilization | 58% | 65% | 79% | 71% | |
LNG Price Assessment and Natural Gas 11th – 22nd December 2017
 |
 |
 |
 |
 |
 |
LNG Analysis
- LNG prices this week driven by Asian prices and remained bullish due to bullish crude prices and strong demand from China & Japan.
- Cold weather in China has resulted in strong demand and gas supply to industries has been reduced to cater to demand from residential sector.
- It was also in the market that due to prevailing cold weather Japan and Korea, market is expecting Japanese buyers to be back in the market post new year.
- Cargo availability for January shipment is not much as majority of cargoes are already finalized.
- Indians are not in the market as current price levels are way too high for Indian market, so they are on the side-line, occasionally coming in the market to check the price.
- During 1st -21st December period US export volume grew from 0.714 MMT in 2016 to 1.19 MMT in 2017 and Australia from 1.39 MMT in 2014 to 3.83 MMT in 2017.
- India imported 1.42 MMT during 1st -21st December 2017 23% increase from 1.15 MMT for the same period in 2016, while Pakistan received 0.30 MMT for the same period.
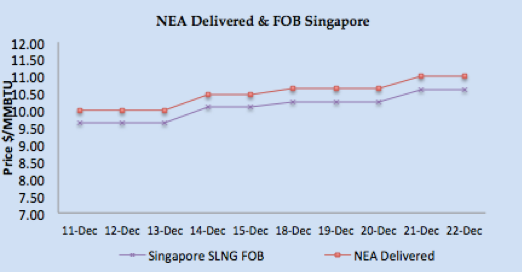
- Asian price closures on Friday; SLNG NEA Delivered at $11.00/MMBTU and FOB Singapore at $10.59/MMBTU.
- Based upon FOB Singapore and Middle East, DES South Asia is calculated around $10.30/MMBTU level. DKI SLNG Index on Friday reported at $10.80/MMBTU.
- JKM Future curve market remained bullish with front month at $11.045/MMBTU along with $9.50/MMBTU & $7.60/MMBTU for March & April 2018 respectively, with February going to be the high demand month now.
- Japan 29, China 13, S. Korea 11 and Taiwan 3 vessels during the week, MTD number as on 21st December stands at Japan 5.51 MMT (92 vessels), China 3.73 MMT (46 vessels), Korea 2.78 MMT (43 vessels) & Taiwan 0.956 MMT (12 vessels).
- China MTD imports stands at 3.73 MMT increased by 35% from last year volume of 2.75 MMT for the same period.
- North West European LNG prices stable as gas hub prices had a bearish run on mild winter & New Year holidays despite bullish crude oil.
- North West Europe closed at around $8.30/MMBTU, premium on January NBP prices.
- South West Europe LNG remained bearish as gas hub corrected in France and Spain due to improvement of availability from nuclear and hydro based power generation.
- Based upon Iberian Peninsula gas hub price, PEG Nord, TRS and PSV along with Asian prices, South Western Europe prices are estimated between $8.70-$9.00/MMBTU.
- Portugal, Italy, Poland, Spain and France received total of 9 cargoes, 5 cargoes for Spain, 4 for France, one each by rest, while Turkey received 3 vessels.
- At the time of writing the report, next one week vessel arrival numbers are; Japan 27, China 11, Korea 11, Taiwan 5, India 6, and Singapore 2, so regular volumes for NE Asian customers.
- Due to increase in Asian prices, arbitrage window is opened for NW & SW Europe both, as netback price is estimated to be around $9.05/MMBTU for NW Europe, whereas for SW Europe the netback is coming around $9.25/MMBTU level.
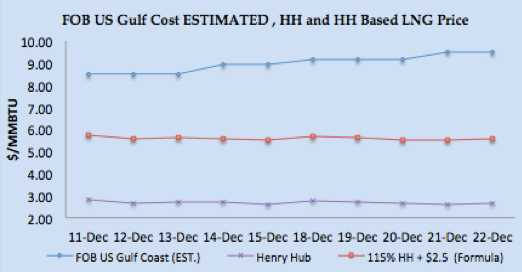
- US Gulf Coast producer price on FOB basis for January delivery for Asian destination comes around $9.50/MMBTU level, for NW European destinations the netback comes around $7.75/MMBTU level and for SW Europe its around $8.50/MMBTU.
- US Henry Hub based price is coming around $5.57/MMBTU for US based liquefaction companies, which translate into margin of $3.40/MMBTU for Asian destination, $2.19/MMBTU for NW Europe and $3.20/MMBTU for SW Europe.
- Current NEA price of $11.00/MMBTU level is estimated to be 18.70% of Brent 3-0-1 basis.
Author’s Comments
- Crude oil prices remained bullish primarily on Forties pipeline issue, adding the fuel for LNG bullish run. US crude production and exports are still on the rise, market is now focusing post holiday procurement as Forties pipeline is expected to be resumed early January.
- Natural gas prices in Europe remained bearish on weather along with resumption of nuclear & hydro based power generation along with improved Norwegian gas flow. This will relieve pressure on LNG prices from Europe and arbitrage window widening from Europe especially SW Europe.
- LNG price now driven through strong demand from China plus additional support coming from Japan. Post New Year holidays, market can keep on having a bullish run on Chinese demand as that’s the only factor dictating the prices, however I believe market is nearing its max level as focus is for February cargoes now with demand traditionally tapering off from March.
LNG Trade Flows (16th – 21st December 2017)
LNG merchant data is developed in collaboration with Clipper Data LLC, due to Thanks Giving holidays, 24th November data will be shared with next week report)
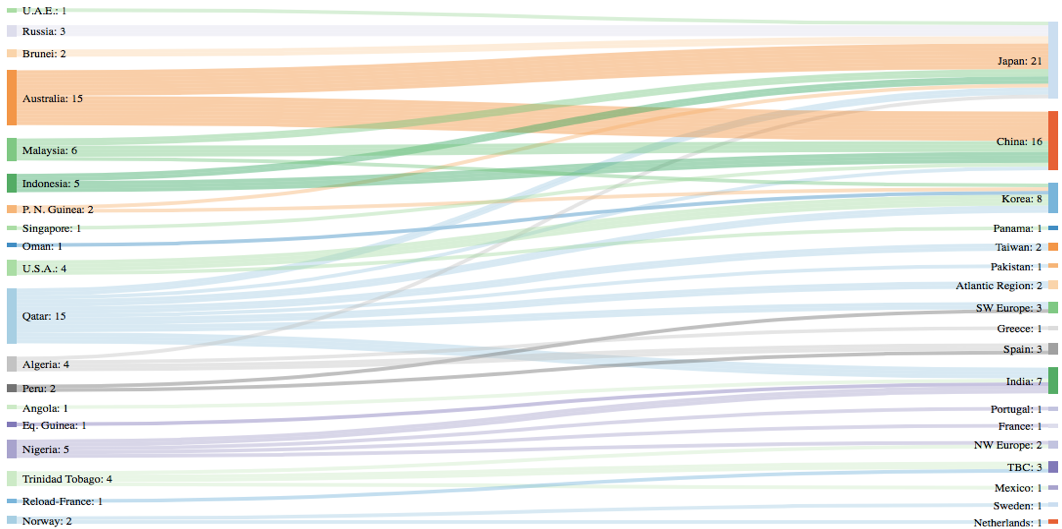
SUPPLY – TRADE FLOWS
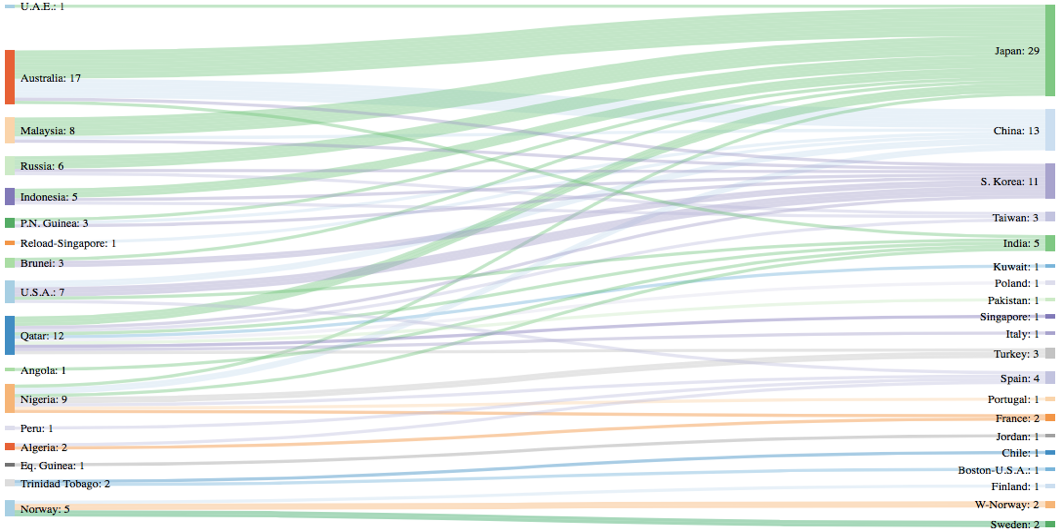
DEMAND – TRADE FLOWS
W-Country- within same country delivery & TBC – To Be Communicated
- 75 vessels carrying 4.96 million tons (238.37 BCF) departed supply ports between 16th – 21st December 2017.
- 84 vessels carrying 5.22 million tons (250.73 BCF) discharged at various demand centres during same time period.
Disclaimer: This is a personal analysis based on public information and should not be used for buying and selling of commodities. Source: SGX LNG Index Group, EIA, GIE, and Reuters.