Market Analysis
Weather
- North West Europe: Cold weather across NW Europe and outlook is same.
- South West Europe: Winter arrived in France Spain and Portugal entering into cold season.
- South America: Weather warm as last week with same outlook for next week.
- Middle East: Middle East still warm and same outlook for next week.
- South Asia: Winter has arrived in India and Pakistan, with demand for heating has increased.
- North East Asia: Cold weather with colder outlook in Japan, Korea and China, whereas Taiwan still in mild
weather. - South East Asia: Still enjoying warm weather.
- North America: Mexico inching toward mild weather, whereas in US west is warm, cold weather is expected for the northern, southern and east.
Crude Oil
- Crude oil prices started settling down post OPEC production cut extension, however turned bullish on Thursday after President Trump announcement about Jerusalem and Chinese strong crude imports data.
- Brent prices closed on $63.40/BBL on Friday, while WTI closed at $57.36/BBL.
- Brent and WTI future in short and long term are in backwardation, translating into investors’ confidence on OPEC production cut and demand/supply balance in long term.
- Future market closure on Friday for Brent at $63.30/BBL, $62.95/BBL & $62.74/BBL for Feb., Mar. & Apr. contracts depicting backwardation, whereas WTI futures closed at $57.34/BBL, $57.38/BBL & $57.44/BBL for January, February & March 2018, depicting contango in short run.
- Baker Hughes rig count reported an increase by 2 to 751 and production still on the rise.
- Brent-WTI spread remained around $5.20 level before closing at $6.04/BBL on Friday.
- US crude Production, Export & Inventory data;
| Million Barrels (MBbl) | 1-Dec-17 | 24-Nov-17 | 17-Nov-17 | 11-Nov-17 |
| Production (MBbl/D) | 9.707 | 9.682 | 9.658 | 9.645 |
| Exports (MBbl/D) | 1.358 | 1.412 | 1.591 | 1.129 |
| Crude Inventory | 448.1 | 453.7 | 457.1 | 459.0 |
| Gasoline Inventory | 220.9 | 214.1 | 210.5 | 210.4 |
- EIA Weekly report reported 5.6 million barrels draw down with stock at 448.1 million barrels on 1st December 2017, against a market expectation of 3.4 million barrels draw down.
- Gasoline inventories at 220.9 million barrels reported on 1st December 2017, 6.8 million barrels build up against a market expectation of 1.7 million barrels buildup.
Natural Gas
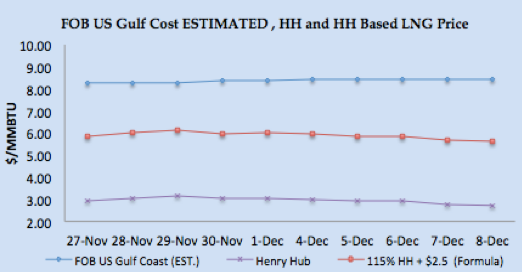
- Henry Hub prices had a bearish run through out the week despite the colder weather outlook and closed at $2.72/MMBTU on Friday.
- Baker Hughes no change gas rigs and total number stands at 180.
- EIA reported working gas in storage is 3,695 BCF as of Friday, 1st December 2017, net increase of 2 BCF, with market expectation of 7 BCF decline.
- The surprise increase in gas inventory has put bullish tone on spot and forward prices.
- CME Henry Hub future on Friday closed at $2.789/MMBTU for January, $2.807/MMBTU for February and $2.782/MMBTU for March, depicting weakness in demand.
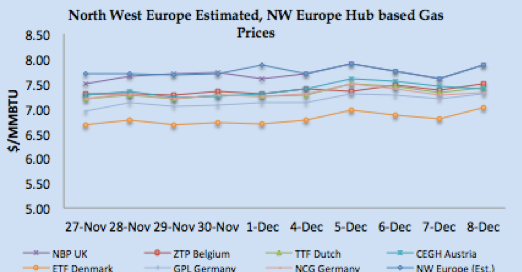
- North West European gas hub prices had a mixed but predominantly due to mixed news from Crude and Weather. Bullish Coal prices along with disruption from Norwegian flows also fueled the bullish run along with Friday bullish closure on Brent.
- As per GASCO data, pipeline based gas supply reduced for Germany, Belgium, and UK due issue at Kollsness, average flows are given below;
BCFD
Germany
France
Belgium
UK
Last 7 Days
4.16
1.83
1.49
4.35
- NBP UK Spot price closed at 57.7600 Pence/Thm ($7.88/MMBTU) on Friday, increased by 4.45% from last Friday.
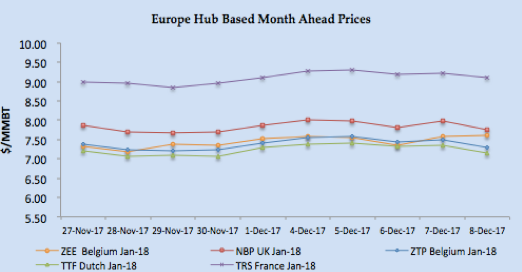
- NBP UK Front month price jumped closed at 57.987 Pence/Thm ($7.76/MMBTU) on Friday, after remaining bullish through out the week.
- TTF Day Ahead prices closed at €21.458/MWH (equivalent of $7.40/MMBTU) whereas front month price closed at €20.740/MWH ($7.16/MMBTU) on Friday.
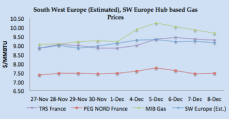
- South West Europe prices followed a bullish run on cold weather in France along with steady to bullish coal prices and low hydro based electricity generation in Spain.
- Spain hydro-based electricity generation deceased from 3.24 TWH to 3.23 TWH, down from peak of 8.24 TWH within 2017.
- Day Ahead PEG Nord closed at €21.634/MWH ($7.46/MMBTU) on Friday, whereas TRS France at €26.915/MWH ($9.29MMBTU), and Spain at €28.00/MWH ($9.66/MMBTU).
- PEG Nord front month closed at €21.643/MWH ($7.47/MMBTU), TRS at €26.423/MWH ($9.12/MMBTU) and Iberian prices at €27.25/MWH ($9.40/MMBTU) on Friday.
- As reported in earlier as month end data, UK received only 2 LNG vessels in the month of November while Spain received the higher number of 22 vessels in November.
Weekly European Gas and LNG quantities at Storage and LNG terminals (BCF)
One standard size Vessel of 150,000 m3 equals to 3.42 BCF.
| Quantity in BCF | 08-Dec-17 | 01-Dec-17 | 24-Nov-17 | 17-Nov-17 | |
| Belgium | Gas | 20.94 | 23.88 | 25.40 | 25.37 |
| LNG | 3.81 | 4.48 | 2.48 | 2.36 | |
| Total | 24.75 | 28.36 | 27.88 | 27.73 | |
| Capacity Utilization | 64% | 73% | 72% | 72% | |
| France | Gas | 280.74 | 300.35 | 316.20 | 325.62 |
| LNG | 17.97 | 16.08 | 21.06 | 16.48 | |
| Total | 298.72 | 316.43 | 337.26 | 342.10 | |
| Capacity Utilization | 61% | 65% | 69% | 70% | |
| Greece | Gas | – | – | – | – |
| LNG | 2.38 | 1.62 | 1.38 | 2.28 | |
| Total | 2.38 | 1.62 | 1.38 | 2.28 | |
| Capacity Utilization | 89% | 60% | 52% | 85% | |
| Italy | Gas | 552.93 | 579.92 | 596.72 | 614.16 |
| LNG | 2.76 | 4.78 | 5.34 | 3.36 | |
| Total | 555.69 | 584.70 | 602.06 | 617.52 | |
| Capacity Utilization | 83% | 87% | 90% | 92% | |
| Lithuania | Gas | – | – | – | – |
| LNG | 1.05 | 1.44 | 1.83 | 2.14 | |
| Total | 1.05 | 1.44 | 1.83 | 2.14 | |
| Capacity Utilization | 31% | 42% | 53% | 62% | |
| Netherlands | Gas | 351.40 | 374.27 | 393.09 | 406.24 |
| LNG | 5.89 | 6.16 | 9.14 | 9.30 | |
| Total | 357.29 | 380.43 | 402.23 | 415.54 | |
| Capacity Utilization | 79% | 84% | 88% | 91% | |
| Poland | Gas | 97.05 | 100.59 | 104.26 | 107.31 |
| LNG | 2.29 | – | – | – | |
| Total | 99.34 | 100.59 | 104.26 | 107.31 | |
| Capacity Utilization | 83% | 84% | 87% | 90% | |
| Portugal | Gas | 6.59 | 6.63 | 6.48 | 6.65 |
| LNG | 4.86 | 4.26 | 2.13 | 5.14 | |
| Total | 11.45 | 10.89 | 8.61 | 11.79 | |
| Capacity Utilization | 57% | 54% | 43% | 58% | |
| Spain | Gas | 79.36 | 81.76 | 83.00 | 84.57 |
| LNG | 32.97 | 36.67 | 32.01 | 31.50 | |
| Total | 112.33 | 118.43 | 115.01 | 116.07 | |
| Capacity Utilization | 64% | 67% | 65% | 66% | |
| UK | Gas | 28.21 | 24.80 | 29.43 | 28.43 |
| LNG | 24.96 | 22.65 | 22.32 | 25.60 | |
| Total | 53.18 | 47.46 | 51.75 | 54.03 | |
| Capacity Utilization | 79% | 71% | 77% | 80% | |
LNG Price Assessment and Natural Gas 27th November – 8th December 2017
 |
 |
 |
 |
 |
 |
LNG Analysis
- LNG prices remained stable to bullish through out the week primarily on increased in 3 months Brent crude price along with demand from Europe due to winter season and expectation of demand from North East Asia, specially Japan and China on cold weather.
- Japanese & Chinese customers bought cargoes from Australia on FOB basis, which is translating into low $10.00/MMBTU on delivered basis.
- Chinese imports has been on the rise, for the month of November the imports in previous years were, 2014 – 1.56 MMT, 2015 – 1.70 MMT, 2016 – 2.73 & jump of 187% from 2014 and now stands at 4.48 MMT in 2017.
- The bearish factor during the middle of the week was from Pakistan second terminal technical issue, which has constrained the terminal to receive cargoes, and there are two vessels at the outer anchorage.
- Supply is adequate post shipment of a cargo from Yamal LNG project and however Japanese buyers regular volumes are curtailed due to Bontang Export facility reduced rates.
- During 2nd -8th December period US export volume grew from 0.216 MMT in 2016 to 0.433 MMT in 2017 and Australia from 0.455 MMT in 2014 to 1.27 MMT in 2017.
- India imported 0.56 MMT during the week, while Pakistan received one cargo during the week.
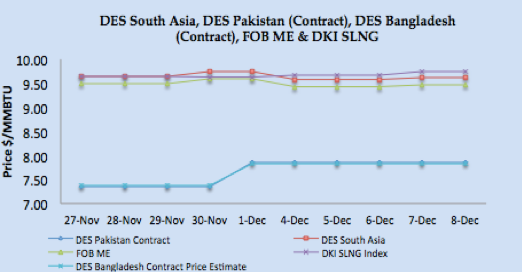
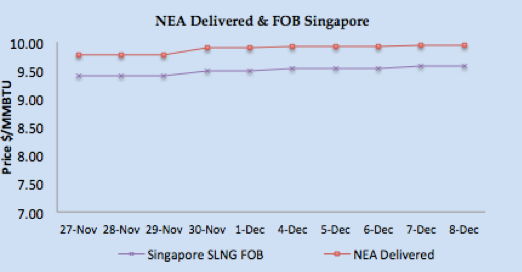
- Asian price closures on Friday; SLNG NEA Delivered at $9.94/MMBTU and FOB Singapore at $9.57/MMBTU.
- Based upon FOB Singapore and Middle East, DES South Asia is calculated around $9.62/MMBTU level. DKI SLNG Index on Friday reported at $9.77/MMBTU.
- JKM Future curve market remained stable with front month at $9.89/MMBTU along with $10.00/MMBTU & $8.80/MMBTU for February & March 2018 respectively, still waiting for deals for the month of January.
- Japan 32, Korea 14, China received 12 and Taiwan 6 vessels during the week, depicting regular contract based supply.
- North West European LNG prices had a bullish run on cold weather with rising coal and mixed crude prices.
- North West Europe closed at around $7.88/MMBTU, inline with NBP UK Spot prices.
- South West Europe LNG also bullish primarily on gas hub prices due to cold weather and robust demand from Spain.
- Based upon Iberian Peninsula gas hub price, PEG Nord and TRS along with Asian prices, South Western Europe prices are estimated in the range of $9.10/MMBTU.
- Portugal, Italy, UK, Belgium, Spain and France received total of 7 cargoes, three cargoes for Spain, two for France, one each by rest, while Turkey received 4 vessels.
- At the time of writing the report, next one week vessel arrival numbers are; Japan 23, China 8, Korea & Taiwan 5 each, and Spain, Turkey, Italy & India two each.
- Arbitrage window still open for cargoes from NW Europe to Asia, as netback price is estimated to be around $8.00 whereas NW Europe price for this week comes around $7.88/MMBTU, whereas for SW Europe the window is closed now, as netback is coming around $8.20/MMBTU level.
- US Gulf Coast producer price on FOB basis for January delivery for Asian destination comes around $8.44/MMBTU level, for NW European destinations the netback comes around $7.33/MMBTU level.
- US Henry Hub based price is coming around $5.63/MMBTU for US based liquefaction companies, which translate into margin of $2.81/MMBTU for Asian destination, $1.55/MMBTU for NW Europe and $2.72/MMBTU for SW Europe.
- Current NEA price of $9.94/MMBTU level is estimated to be 17.00% of Brent 3-0-1 basis.
- Pakistan LNG recent closure for February deliveries on Brent based formulas coming around $9.79/MMBTU at $63/BBL of Brent and $10.10/MMBTU at $65/BBL of Brent, good buying strategy specially of Pakistan can hedge the Brent price against rise above $65/BBL level.
Author’s Comments
- Crude oil price is expected to remain stable keeping in view Middle East tension as OPEC production cut extension already incorporated, the down side is US increased production number, which is on the rise.
- Natural gas prices in Europe are now high and its peak winter season, so European gas prices will remain stable to bullish.
- As reported last week, LNG prices still at a volatile point with bullish demand from Asian and European markets, Indian market is little bit de-linked due to chance of diverting cargoes from Pakistan, I believe price will be bullish for January.
LNG Trade Flows (2nd – 8th December 2017)
LNG merchant data is developed in collaboration with Clipper Data LLC, due to Thanks Giving holidays, 24th November data will be shared with next week report)
SUPPLY – TRADE FLOWS
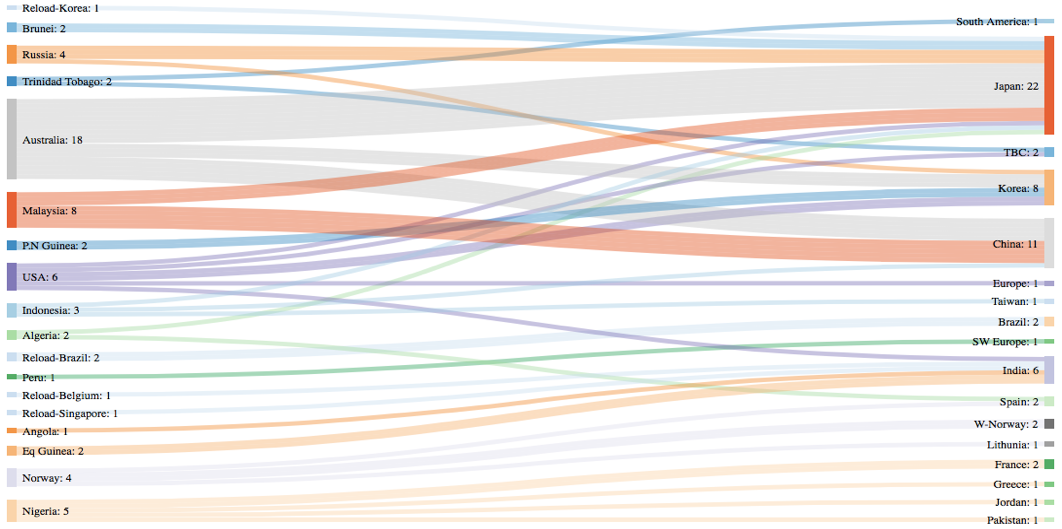
DEMAND – TRADE FLOWS

W-Country- within same country delivery & TBC – To Be Communicated
- 9 vessels carrying 6.39 million tons (307.16 BCF) loaded during the week.
- 102 vessels carrying 6.66 million tons (319.90 BCF) discharged at various demand centres during same time period.
Disclaimer: This is a personal analysis based on public information and should not be used for buying and selling of commodities. Source: SGX LNG Index Group, EIA, GIE, and Reuters.