Market Analysis
Weather
- North West Europe: Weather is easing a bit and outlook is above seasonal levels.
- South West Europe: Mild weather with milder weather outlook for next week.
- South America: Mild to warm with same outlook for next week.
- Middle East: Mild weather prevailing in Middle East.
- South Asia: India and Pakistan mild to cold weather, with same outlook for next week.
- North East Asia: Except for Taiwan, which is in mild weather, cold weather is China, Japan & South Korea, while mild weather prevailing in Taiwan.
- South East Asia: Warm weather in South East Asia.
- North America: Mexico still enjoying mild weather, cold weather still prevailing in US excluding South and South East regions, outlook s weather to be easing.
Crude Oil
- Brent prices closed on $68.61/BBL on Friday from $70.26/BBL on Monday, while WTI closed at $64.30/BBL.
- Crude oil finally had an expected stable to bearish run through out the week based upon increased US production, reduced demand outlook for 2018 and expectation of long position to be cashed out.
- Future market closure on Friday for Brent front month at $68.61/BBL, with $68.24/BBL & $67.90/BBL for April & May, whereas WTI front month (Feb) at $63.37/BBL, $63.16/BBL for March & $63.16/BBL for April.
- Brent future still depicting OPEC supply rationalization via backwardation, whereas WTI productions oversupply impacting WTI future.
- Both EIA and OPEC revised crude production upward for 2018, with US production revision by 0.97 MBbl/D and OPEC by 1.1 MBbl/D.
- Baker Hughes oil-rig count reported decrease by 5 and, the number stays at 747.
- Brent-WTI spread reduced from the start of week and closed at $5.24/BBL on Friday, substantiating WTI production & export increase.
- US crude production increased by 258,000 Barrel during the week, US Production, Export & Inventory data;
| Million Barrels (MBbl) | 12-Jan-2018 | 05-Jan-2018 | 29-Dec-17 | 22-Dec-17 |
| Production (MBbl/D) | 9.750 | 9.492 | 9.782 | 9.754 |
| Exports (MBbl/D) | 1.249 | 1.015 | 1.475 | 1.210 |
| Crude Inventory | 412.7 | 419.8 | 424.5 | 431.9 |
| Gasoline Inventory | 240.9 | 237.3 | 233.2 | 228.4 |
- EIA Weekly report reported 6.86 million barrels draw down with stock at 412.7 million barrels on 12th January 2018, against a market expectation of 3.54 million barrels draw down.
- Gasoline inventories at 240.9 million barrels reported on 12th January 2018, 3.62 million barrels build up against a market expectation of 3.42 million barrels buildup.
Natural Gas
- Henry Hub gas prices remained bullish through out the week due to cold weather, especially in North East, Northern Rockies, Mid Atlantic and part of South.
- Baker Hughes reported an increase in gas rigs by 2 and total number stands at 189.
- EIA reported working gas in storage is 2,584 BCF as of Friday, 12th January 2018, net decrease of 183 BCF, with market expectation of 199 BCF decline.
- Overall weather outlook for all cold regions and South is warmer than current week, so demand is expected to be low.
- Henry Hub closure on Friday was $3.19/MMBTU, whereas the future market closures were $3.148/MMBTU for February, $2.957/MMBTU for March and $2.786/MMBTU for April, depicting lesser demand in future months.
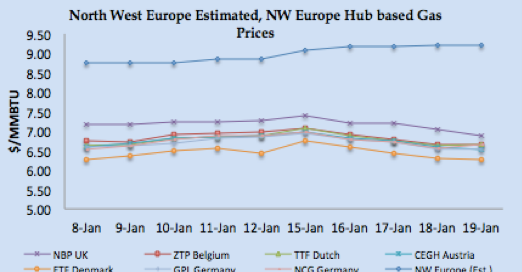
- North West European gas hub prices had a bearish run during the week due to above seasonal limit weather outlook, adequate gas supply from Russia and Norway & bearish crude oil prices.
- Minimal reduction in gas flow from Norway to UK and Germany due to issues at Heimdal & Oseberg fields.
- Gas Flow into Europe:
| BCFD | Norwegian Gas Flow | Nord Stream | ||||
| Germany | France | Belgium | UK | OPAL | NEL | |
| 6th – 12th January 2018 | 3.98 | 1.80 | 1.57 | 4.83 | 3.73 | 2.24 |
| 13th – 19th January 2018 | 3.83 | 1.79 | 1.55 | 4.57 | 3.75 | 2.23 |
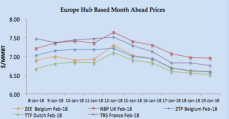
- NBP UK Spot price reduced by 6.14% to 49.638 Pence/Thm ($6.88/MMBTU) on Friday, whereas in the curve market front month February plunged to 50.21 Pence/Thm ($6.95/MMBTU).
- TTF Spot price moved south with closure at €18.534/MWH ($6.64/MMBTU), 3.75% decrease from last Friday, whereas front month price closed at €18.179/MWH ($6.51/MMBTU) on Friday.
Weekly European Gas and LNG quantities at Storage and LNG terminals (BCF)
One standard size Vessel of 150,000 m3 equals to 3.42 BCF.
| Quantity in BC | 19-Jan-2018 | 12-Jan-2018 | 5-Jan-2018 | 29-Dec-2017 | |
| Belgium | Gas | 9.46 | 10.34 | 12.47 | 13.00 |
| LNG | 2.97 | 3.48 | 1.38 | 2.18 | |
| Total | 12.44 | 13.82 | 13.85 | 15.18 | |
| Capacity Utilization | 32% | 36% | 36% | 39% | |
| France | Gas | 191.95 | 212.06 | 229.81 | 238.07 |
| LNG | 16.80 | 16.99 | 19.39 | 17.19 | |
| Total | 208.75 | 229.05 | 249.19 | 255.25 | |
| Capacity Utilization | 43% | 47% | 51% | 52% | |
| Germany | Gas | 457.57 | 491.25 | 518.29 | 528.60 |
| LNG | – | – | – | – | |
| Total | 457.57 | 491.25 | 518.29 | 528.60 | |
| Capacity Utilization | 58% | 62% | 65% | 67% | |
| Greece | Gas | – | – | – | – |
| LNG | 2.23 | 1.30 | 2.59 | 1.74 | |
| Total | 2.23 | 1.30 | 2.59 | 1.74 | |
| Capacity Utilization | 83% | 48% | 96% | 65% | |
| Italy | Gas | 423.54 | 451.37 | 472.50 | 490.17 |
| LNG | 4.95 | 5.89 | 6.56 | 1.56 | |
| Total | 428.49 | 457.26 | 479.06 | 491.73 | |
| Capacity Utilization | 64% | 68% | 72% | 74% | |
| Lithuania | Gas | – | – | – | – |
| LNG | 2.58 | 2.76 | 2.79 | 2.93 | |
| Total | 2.58 | 2.76 | 2.79 | 2.93 | |
| Capacity Utilization | 75% | 80% | 81% | 85% | |
| Netherlands | Gas | 230.37 | 253.81 | 276.97 | 287.84 |
| LNG | 4.15 | 4.27 | 4.54 | 4.69 | |
| Total | 234.52 | 258.08 | 281.52 | 292.53 | |
| Capacity Utilization | 52% | 57% | 62% | 64% | |
| Poland | Gas | 77.01 | 82.73 | 86.59 | 88.47 |
| LNG | 5.05 | 5.74 | 2.50 | 3.85 | |
| Total | 82.06 | 88.46 | 89.09 | 92.32 | |
| Capacity Utilization | 68% | 74% | 74% | 77% | |
| Portugal | Gas | 6.16 | 6.23 | 6.94 | 6.41 |
| LNG | 7.29 | 7.03 | 6.87 | 2.13 | |
| Total | 13.45 | 13.26 | 13.81 | 8.54 | |
| Capacity Utilization | 66% | 66% | 68% | 42% | |
| Spain | Gas | 73.47 | 74.29 | 75.36 | 75.44 |
| LNG | 34.06 | 37.56 | 32.12 | 29.64 | |
| Total | 107.53 | 111.85 | 107.48 | 105.08 | |
| Capacity Utilization | 61% | 63% | 61% | 60% | |
| UK | Gas | 24.90 | 26.06 | 27.37 | 20.00 |
| LNG | 18.35 | 20.37 | 25.75 | 29.87 | |
| Total | 43.26 | 46.42 | 53.12 | 49.88 | |
| Capacity Utilization | 64% | 69% | 79% | 74% | |
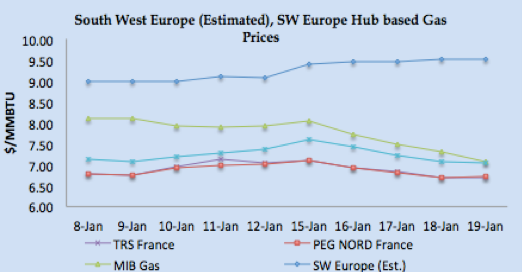
- South West Europe gas hub prices also moved southward due to regular vessel arrivals, adequate gas inventory, mild weather outlook, along with an improvement of nuclear power & hydro based generation in France and Spain.
- Spain hydro-based electricity generation increased from last week 5.26 TWH to 5.34 TWH, still lower number than last year 6.892 TWH.
- Nuclear power generation improved by 5.83% in France for the same period last month.
- French Day Ahead prices: PEG Nord closed at €18.729 MWH ($6.71/MMBTU) whereas TRS France closed at €18.715/MWH ($6.70 MMBTU) on Friday.
- Italian PSV reduced to €19.646/MWH ($7.04/MMBTU) and Spain at €19.720/MWH ($7.06/MMBTU).
- Front month prices remained stable to bullish with PEG Nord closed at €18.432/MWH ($6.60/MMBTU), TRS at €18.862/MWH ($6.76/MMBTU), PSV at €19.879/MWH ($7.12/MMBTU) on Friday, whereas Iberian prices at €20.300/MWH ($7.27/MMBTU).
LNG Price Assessment and Natural Gas 8th – 19th January 2018
 |
 |
 |
 |
 |
 |
LNG Analysis
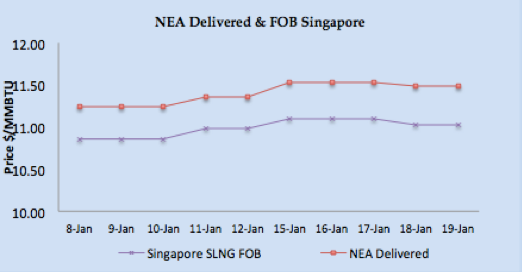
- Global LNG prices are taking direction from bullish North East Asian delivered prices due to cold weather outlook, demand from Japan, South Korea and Chinese customers along production issues at Angola, Malaysia and Russia and touched around $11.75/MMBTU on Friday.
- Asian price closures on Friday; SLNG NEA Delivered at $11.482/MMBTU and FOB Singapore at $11.030/MMBTU.
- JKM Future curve market remained bullish with front month (March 2018) now at $10.540/MMBTU.
- Japan received 1.94 MMT (30 vessels), China 1.68 MMT (21 vessels), S. Korea 0.95 MMT (14 vessels) and Taiwan 0.343 MMT (6 vessels) during the week.
- MTD import figures for Japan at 5.54 MMT (89 vessels), China at 3.76 MMT (58 vessels), South Korea 3.14 MMT (46 vessels) & Taiwan 0.94 MMT (17 vessels), depicting cold weather based procurement from Japan, China & Korea.
- Based upon FOB Singapore and Middle East, DES South Asia is calculated around $10.93/MMBTU level, DKI SLNG Index on Friday reported at $11.081/MMBTU.
- India imported 0.37 MMT (5 vessels), MTD 2.17 MMT (15 vessels), while Pakistan received 0.24 MMT (3 vessels) during the week, with MTD 0.44 MMT (6 vessels).
- North West European LNG prices taking direction from Asian prices as demand is low due to warmer weather outlook.
- North West Europe LNG prices estimated at around $9.21/MMBTU level based upon Asian prices.
- South West Europe LNG prices also got the direction from Asian prices due to arbitrage window widening and estimated to be around $9.50/MMBTU level.
- Spain received 4, France received 3, Italy 2, and Portugal & UK received one cargo each, while Turkey received 4 vessels, there is one reload cargo left from France this week.
- Chile & Mexico received one cargo each during the week.
- Canada received one cargo while USA received 3 cargoes, two at Boston and one at Georgia.
- Due to high NE Asia prices, arbitrage window is opened for European LNG terminal as netback price is coming between $9.00/MMBTU-$9.20/MMBTU.
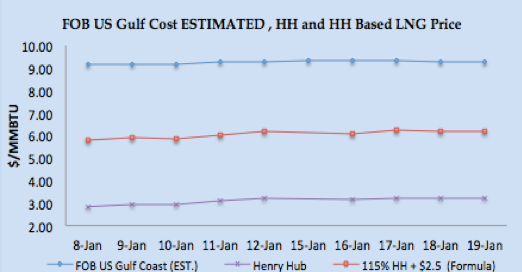
- US Gulf Coast producer price on FOB basis for January delivery for Asian destination comes around $9.28/MMBTU level, for NW European destinations the netback comes around $8.26/MMBTU level and for SW Europe its around $8.56/MMBTU.
- US Henry Hub based price is coming around $6.17/MMBTU on Friday for US based liquefaction companies, which translate into margin of $3.11/MMBTU for Asian destination, $2.09/MMBTU for NW Europe and $2.39/MMBTU for SW Europe.
- Three cargoes left from Sabine Pass export terminal during the week.
- Current NEA price around $11.75/MMBTU level is estimated to be 19.10% of Brent 3-0-1 basis.
Author’s Comments
- As analyzed last week, fundamentals and profit taking have taken over and crude prices rationalized. Now going forward we believe there is bearish to stable run, excluding any geo-political abrupt event from Yemen, Iran or North Korea.
- US and European gas hub prices outlook is bearish keeping in view weather outlook &adequate inventory level. Fundamentally, European gas hub is not at all impacting global LNG prices and this trend is expected to prevail in the short term.
- LNG price bullish run supported by cold weather outlook along with production issues, however, market participants are now expecting a bullish run to be short lived. Japan, Taiwan, Korean and Indian buyers still relying on contractual volumes. We expect very few transactions to happen now for February cargoes, and prices will still have bullish pressure due to Bintulu production issue. However, prices are now expected to ease a bit in a couple of weeks based mild weather outlook in Europe, bearish crude prices and wait-and-see mode from Indian customers.
LNG Trade Flows (13th – 19th January 2018)
LNG merchant data is developed in collaboration with Clipper Data LLC, due to Thanks Giving holidays, 24th November data will be shared with next week report)
SUPPLY – TRADE FLOWS
98 vessels carrying 6.59 million tons (316.64 BCF) left supply terminal centres between 13th– 19th January 2018.
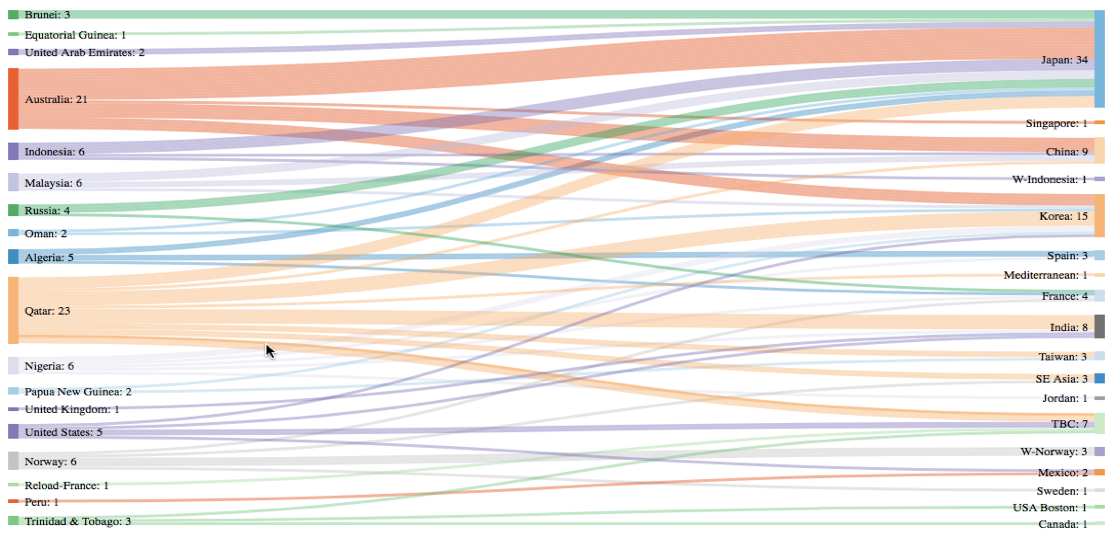
DEMAND – TRADE FLOWS
108 vessels carrying 7.05 million tons (338.86 BCF) discharged at various demand centres during same time period.
W-Country- within same country delivery & TBC – To Be Communicated
Disclaimer: This is a personal analysis based on public information and should not be used for buying and selling of commodities. Source: SGX LNG Index Group, EIA, GIE, and Reuters.