Market Analysis
Weather
- North West Europe: Weather is still cold but warmer than seasonal limits and expected to further ease up next week.
- South West Europe: Mild cold weather with outlook for same weather next week.
- South America: Mild weather in Argentina & warm in the remaining region and the same outlook for next week.
- Middle East: Still enjoying the mild weather.
- South Asia: India and Pakistan mild to cold weather, with the same outlook for next week.
- North East Asia: Mild weather in Taiwan, while severe cold weather is prevailing China, Japan & South Korea with the same outlook for next week.
- South East Asia: Within the seasonal limits of warm weather with the same outlook.
- North America: Mexico still enjoying mild weather, cold weather still prevailing in West, Northern Rockies, Midwest and North East, while mild weather in West & South, colder weather outlook.
Crude Oil
- Crude oil prices had a bullish run throughout the week on healthier economic data from IMF, USD weak performance, lower inventory numbers from EIA, geopolitical tension and OPEC plus Russia re-emphasizing on production cut deal.
- The International Monetary Fund (IMF) revised global economic growth forecast on 22nd January 2018 from 3.7% to 3.9%.
- US Dollar Index shed 1.48% since the start of the week; while US Treasury Secretary believes weaker dollar helps US trade.
- A coalition of Nigerian militants listed numbers of oil fields and installation as targets for attacks if the federal government fails to address their issues.
- Inventory in Cushing at 39.4 Million barrels down from 64.55 million barrels on 3rd November 2017 and last year number of 65.4 million barrels, primarily the impact of reduced supply from Keystone pipeline.
- Brent prices closed on $70.52/BBL on Friday from $70.26/BBL on Monday, while WTI closed at $66.14/BBL, with Brent-WTI spread shrinking to $4.38/BBL on Friday.
- Future market closure on Friday for Brent front month at $70.42/BBL, with $69.97/BBL & $69.60/BBL for April & May, whereas WTI front month (Mar) at $66.24/BBL, $66.01/BBL for April & $65.65/BBL for May.
- Brent & WTI futures in backwardation due OPEC supply rationalization & lower inventory in Cushing.
- Baker Hughes oil-rig count reported an increase by 12 and total oil-rigs number at 759.
- US crude production increased by 128,000 Barrel during the week, US Production, Export & Inventory data;
| Million Barrels (MBbl) | 19-Jan-2018 | 12-Jan-2018 | 05-Jan-2018 | 29-Dec-17 |
| Production (MBbl/D) | 9.878 | 9.750 | 9.492 | 9.782 |
| Exports (MBbl/D) | 1.411 | 1.249 | 1.015 | 1.475 |
| Crude Inventory | 411.6 | 412.7 | 419.8 | 424.5 |
| Gasoline Inventory | 244.0 | 240.9 | 237.3 | 233.2 |
- EIA Weekly report reported 1.07 million barrels draw down with stock at 411.6 million barrels on 19th January 2018, against a market expectation of 1.00 million barrels draw down.
- Gasoline inventories at 244.0 million barrels reported on 19th January 2018, 3.10 million barrels build up against a market expectation of 2.50 million barrels buildup.
Natural Gas
- Henry Hub gas prices had a bullish run due to prevailing cold weather and colder weather outlook for next week, which also got supported by gas inventory below 5 year historical level.
- EIA reported working gas in storage is 2,296 BCF as of Friday, 19th January 2018, net decrease of 288 BCF, in line with market expectations.
- Baker Hughes reported a decrease in gas rigs by 1 and total number stands at 188.
- Henry Hub closure on Friday was $3.510/MMBTU, whereas the future market closures were $3.520/MMBTU for February, $3.169/MMBTU for March and $2.918/MMBTU for April, depicting strength due to prevailing cold weather.
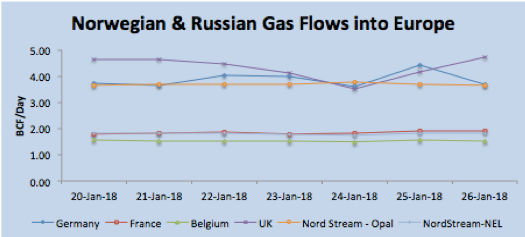
- North West European gas hub prices remained bearish despite lower gas flows to Germany & UK from Norway due to an ongoing issue at Heimdal filed and St. Fergus terminal. However curve market ended on bullish tone due to higher crude oil prices.
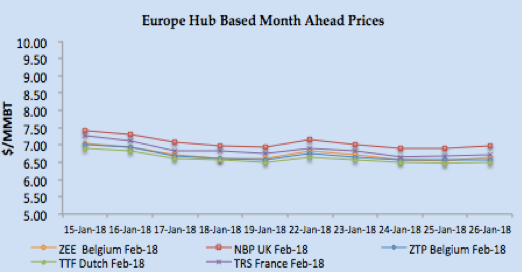
- NBP UK Spot price reduced by 4.51% from last Friday to 47.399 Pence/Thm ($6.71/MMBTU) on Friday, whereas front month February regained on Friday to close at 350Pence/Thm ($6.99/MMBTU).
- TTF Spot price followed NBP with closure at €17.830/MWH ($6.49/MMBTU), 3.80% decrease from last Friday, whereas front month price closed at €17.860/MWH ($6.51/MMBTU) on Friday.
- South West Europe gas hub prices also had a bearish run due to moderate weather along with improved nuclear power & hyrdo based generation in France and Spain.
- Spain hydro-based electricity generation increased from last week 5.34 TWH to 5.39 TWH, still lower number than last year 6.44 TWH.
- French Day Ahead prices: PEG Nord closed at €17.842 MWH ($6.50/MMBTU) whereas TRS France closed at €17.850/MWH ($6.50 MMBTU) on Friday, reduced by $0.20/MMBTU from last week.
- Italian PSV reduced to €19.320/MWH ($7.04/MMBTU) and Iberian Day Ahead prices at €18.940/MWH ($6.90/MMBTU).
- Front month prices remained bearish throughout the week, however, got some support on Friday due to bullish crude prices, with PEG Nord closed at €18.095/MWH ($6.59/MMBTU), TRS at €18.405/MWH ($6.70/MMBTU), PSV at €19.641/MWH ($7.15/MMBTU) on Friday, whereas Iberian forward price last deal was on Thursday at €19.65/MWH ($7.15/MMBTU).:
| BCFD | Norwegian Gas Flow | Nord Stream | ||||
| Germany | France | Belgium | UK | OPAL | NEL | |
| 6th – 12th January 2018 | 3.98 | 1.80 | 1.57 | 4.83 | 3.73 | 2.24 |
| 13th – 19th January 2018 | 3.83 | 1.79 | 1.55 | 4.57 | 3.75 | 2.23 |
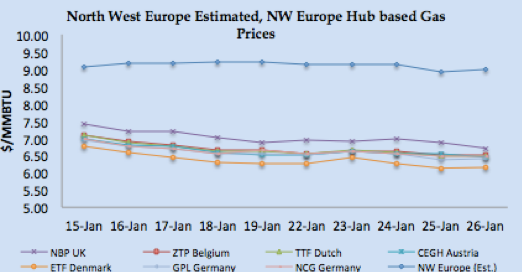
- NBP UK Spot price reduced by 6.14% to 49.638 Pence/Thm ($6.88/MMBTU) on Friday, whereas in the curve market front month February plunged to 50.21 Pence/Thm ($6.95/MMBTU).
- TTF Spot price moved south with closure at €18.534/MWH ($6.64/MMBTU), 3.75% decrease from last Friday, whereas front month price closed at €18.179/MWH ($6.51/MMBTU) on Friday.
Weekly European Gas and LNG quantities at Storage and LNG terminals (BCF)
One standard size Vessel of 150,000 m3 equals to 3.42 BCF.
| Quantity in BC | 26-Jan-18 | 19-Jan-18 | 12-Jan-18 | 05-Jan-18 | |
| Belgium | Gas | 8.18 | 9.46 | 10.34 | 12.47 |
| LNG | 2.46 | 2.97 | 3.48 | 1.38 | |
| Total | 10.64 | 12.44 | 13.82 | 13.85 | |
| Capacity Utilization | 28% | 32% | 36% | 36% | |
| France | Gas | 172.61 | 191.95 | 212.06 | 229.81 |
| LNG | 19.33 | 16.80 | 16.99 | 19.39 | |
| Total | 191.93 | 208.75 | 229.05 | 249.19 | |
| Capacity Utilization | 39% | 43% | 47% | 51% | |
| Germany | Gas | 435.77 | 457.57 | 491.25 | 518.29 |
| LNG | – | – | – | – | |
| Total | 435.77 | 457.57 | 491.25 | 518.29 | |
| Capacity Utilization | 55% | 58% | 62% | 65% | |
| Greece | Gas | – | – | – | – |
| LNG | 2.39 | 2.23 | 1.30 | 2.59 | |
| Total | 2.39 | 2.23 | 1.30 | 2.59 | |
| Capacity Utilization | 89% | 83% | 48% | 96% | |
| Italy | Gas | 396.47 | 423.54 | 451.37 | 472.50 |
| LNG | 5.52 | 4.95 | 5.89 | 6.56 | |
| Total | 401.99 | 428.49 | 457.26 | 479.06 | |
| Capacity Utilization | 60% | 64% | 68% | 72% | |
| Lithuania | Gas | – | – | – | – |
| LNG | 2.16 | 2.58 | 2.76 | 2.79 | |
| Total | 2.16 | 2.58 | 2.76 | 2.79 | |
| Capacity Utilization | 63% | 75% | 80% | 81% | |
| Netherlands | Gas | 209.83 | 230.37 | 253.81 | 276.97 |
| LNG | 3.87 | 4.15 | 4.27 | 4.54 | |
| Total | 213.70 | 234.52 | 258.08 | 281.52 | |
| Capacity Utilization | 47% | 52% | 57% | 62% | |
| Poland | Gas | 71.90 | 77.01 | 82.73 | 86.59 |
| LNG | 4.40 | 5.05 | 5.74 | 2.50 | |
| Total | 76.31 | 82.06 | 88.46 | 89.09 | |
| Capacity Utilization | 64% | 68% | 74% | 74% | |
| Portugal | Gas | 6.32 | 6.16 | 6.23 | 6.94 |
| LNG | 5.25 | 7.29 | 7.03 | 6.87 | |
| Total | 11.57 | 13.45 | 13.26 | 13.81 | |
| Capacity Utilization | 57% | 66% | 66% | 68% | |
| Spain | Gas | 73.06 | 73.47 | 74.29 | 75.36 |
| LNG | 31.48 | 34.06 | 37.56 | 32.12 | |
| Total | 104.54 | 107.53 | 111.85 | 107.48 | |
| Capacity Utilization | 59% | 61% | 63% | 61% | |
| UK | Gas | 24.48 | 24.90 | 26.06 | 27.37 |
| LNG | 16.54 | 18.35 | 20.37 | 25.75 | |
| Total | 41.02 | 43.26 | 46.42 | 53.12 | |
| Capacity Utilization | 61% | 64% | 69% | 79% | |
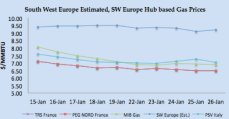
- South West Europe gas hub prices also moved southward due to regular vessel arrivals, adequate gas inventory, mild weather outlook, along with an improvement of nuclear power & hydro based generation in France and Spain.
- Spain hydro-based electricity generation increased from last week 5.26 TWH to 5.34 TWH, still lower number than last year 6.892 TWH.
- Nuclear power generation improved by 5.83% in France for the same period last month.
- French Day Ahead prices: PEG Nord closed at €18.729 MWH ($6.71/MMBTU) whereas TRS France closed at €18.715/MWH ($6.70 MMBTU) on Friday.
- Italian PSV reduced to €19.646/MWH ($7.04/MMBTU) and Spain at €19.720/MWH ($7.06/MMBTU).
- Front month prices remained stable to bullish with PEG Nord closed at €18.432/MWH ($6.60/MMBTU), TRS at €18.862/MWH ($6.76/MMBTU), PSV at €19.879/MWH ($7.12/MMBTU) on Friday, whereas Iberian prices at €20.300/MWH ($7.27/MMBTU).
LNG Price Assessment and Natural Gas 15th – 26th January 2018
 |
 |
 |
 |
 |
 |
LNG Analysis
- Global LNG prices dictated by Asian prices, finally retreated and had a bearish run despite cold weather in Japan, China and South Korea, as Chinese buyers remained on the side-lines while Japan, South Korea & Taiwan relied on contractual volumes.
- Supply issue resolution from Malaysia, Russia, Angola and US also added to bearish sentiments.
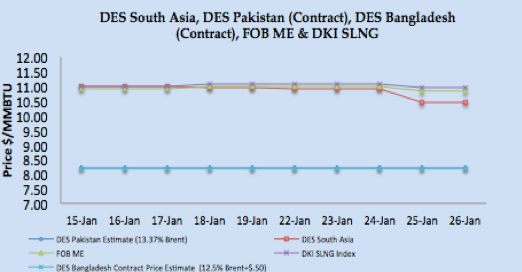
- Asian price closures on Friday; NEA Delivered at $11.37/MMBTU, while long term contract based prices at $8.22/MMBTU for Pakistan & $8.91/MMBTU for Asian destinations (14.5% Brent based).
- JKM Future curve market also followed the spot market trend with closure at $9.94/MMBTU on Friday.
- Japan received 1.43MMT (22 vessels), China 0.67MMT (10 vessels), S. Korea 0.39MMT (6 vessels) and Taiwan 0.32MMT (5 vessels) during the week, NEA represent 51.18% of a global trade this week.
- MTD import figures for Japan at 6.97MMT (111 vessels), China at 4.43MMT (68 vessels), South Korea 3.53MMT (52 vessels) & Taiwan 1.26MMT (22 vessels).
- DES South Asia is calculated around $10.43/MMBTU level.
- India imported 0.44MMT (6 vessels), MTD 2.61MMT (21 vessels), while Pakistan received 0.06MMT (1 vessels) during the week, with MTD 0.50MMT (7 vessels).
- North West European LNG prices taking direction from Asian prices as demand is low due to warmer weather outlook and regular pipelined supply.
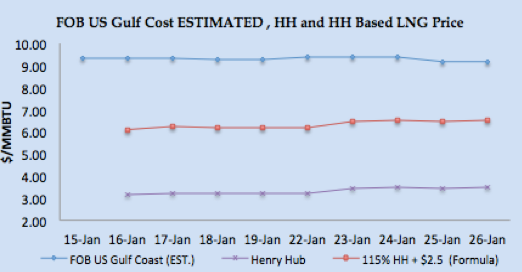
- North West Europe LNG prices estimated at around $9.00/MMBTU level based upon Asian prices.
- South West Europe LNG followed the global LNG price trend and closed at $9.20/MMBTU level.
- Spain received 5, France received 4, Italy 2, while Lithuania, Netherlands, Malta, Netherlands, and Portugal received one cargo each. Turkey received two cargoes during the week.
- Reload cargoes: One cargo left from India to Japan while another cargo left from Spain.
- Chile received two cargoes, while Brazil, Mexico & Puerto Rico received one cargo each during the week. Canada & USA received one cargo each.
- Asian prices still attractive for European terminals with arbitrage window still open with netback price is coming between $9.00/MMBTU-$9.20/MMBTU.
- US Gulf Coast producer price on FOB basis for February delivery for Asian destination comes around $9.15/MMBTU level, for NW European destinations the netback comes around $8.15/MMBTU level and for SW Europe its around $8.30/MMBTU.
- US Henry Hub based price is coming around $6.54/MMBTU on Friday for US based liquefaction companies, which translate into a margin of $2.64/MMBTU for Asian destination, $1.62/MMBTU for NW Europe and $1.80/MMBTU for SW Europe.
- Four cargoes left from Sabine Pass export terminal during the week, destined for Korea, Mexico & Mediterranean with one destination yet to be declared.
- Current NEA price around $11.37/MMBTU level is estimated to be 18.50% of Brent 3-0-1 basis.
Author’s Comments
- Crude oil this week has been dictated by issues, which are temporary in nature, however, the timing of resolution of those issues will ensure fundamentals to take control. Currently weaker, along with lower US inventories are the main bullish factor, however, looking at the resumption of Keystone pipeline and additional oil rigs this week will definitely put pressure on crude prices.
- US Henry Hub prices had a bullish run and looking at weather with enhanced heating requirement, the outlook is bullish for next week, European gas hub prices are bearish on mild weather outlook, and current gas hub prices in Europe are not impacting LNG prices, sellers like to sell at Brent based pricing for cargoes strips.
- The market is now focusing on March deliveries, with weather outlook easing for Europe and March will be less cold in North East Asia. Winter season based procurement almost done with adequate supply availability, price trend will be bearish, we expect thin spot trading during next week and the trend to last until Chinese new year.
LNG Trade Flows (20th – 26th January 2018)
LNG merchant data is developed in collaboration with Clipper Data LLC, due to Thanks Giving holidays, 24th November data will be shared with next week report)
SUPPLY – TRADE FLOWS
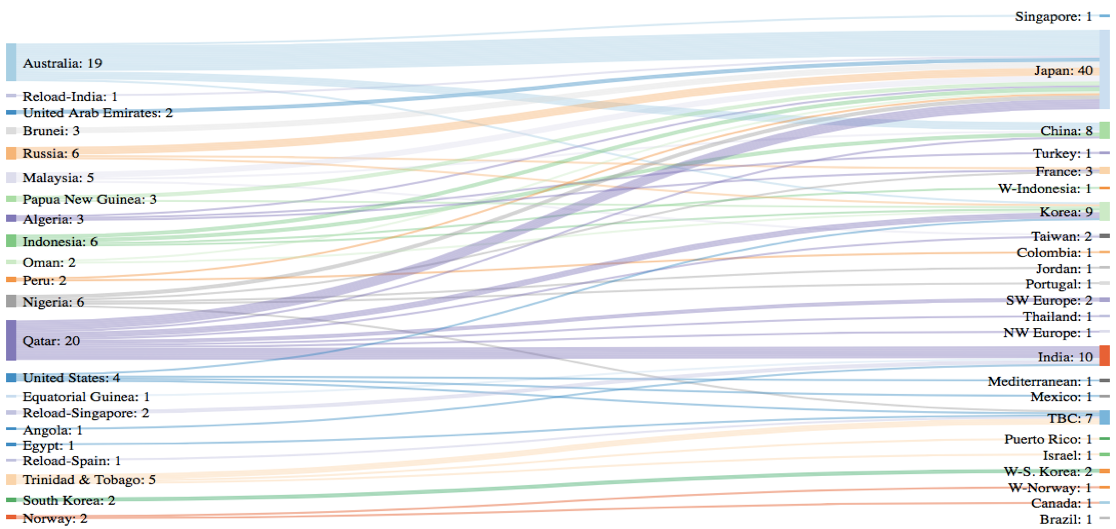
98 vessels carrying 6.94 million tons (333.57 BCF) left supply terminal centers between 20th– 26th January 2018.
DEMAND – TRADE FLOWS
85 vessels carrying 5.49 million tons (263.78 BCF) discharged at various demand centers during the same time period.

Disclaimer: This is a personal analysis based on public information and should not be used for buying and selling of commodities. Source: SGX LNG Index Group, EIA, GIE, and Reuters.