Market Analysis
Weather
- North West Europe: Weather still cold, eased 1-2 degrees over the weekend, with colder outlook for next week.
- South West Europe: Cold to mild weather especially in Spain & France with the same outlook for next week.
- South America: Warm weather prevailing.
- Middle East: Warm to mild weather.
- South Asia: Mild weather in south of India & Pakistan, while winter in full swing in the northern part.
- North East Asia: Extreme cold weather for Northern China along with other parts of China. Japan and South Korea faced severe cold weather last three days and will ease next week, whereas Taiwan still warm.
- South East Asia: Warm weather still prevailing.
- North America: Mexico still enjoying mild to warm weather, whereas US remained cold last week with exception of Sothern part, next week weather is eased little bit but still same cold in Northern, Rockies and Upper Midwest
Crude Oil
- Crude oil continued to have a bullish run with earlier week run was attributed to decrease in oil rig number, which was further supported by EIA weekly inventory draw down, severe cold weather related reduced production.
- Brent prices closed on $69.87/BBL on Friday, while WTI closed at $64.30/BBL, three year high
- Future market closure on Friday for Brent front month (March 2018) at $69.78/BBL, with $69.35/BBL & $68.80/BBL for April & May, whereas WTI front month (Feb) at $64.40/BBL, $64,33/BBL for March & $64.12/BBL for April.
- Brent and WTI future market still depicting confidence on OPEC production cut through backwardation.
- Baker Hughes oil-rig count reported highest increase of 10 since May 2017, oil rig number stayed at 752.
- Brent-WTI spread reduced from the start of week and closed at $5.57/BBL on Friday, emphasizing WTI bullish run.
- US crude production reduced by 290,000 Barrel during the week.
- US crude Production, Export & Inventory data;
| Million Barrels (MBbl) | 05-Jan-2018 | 29-Dec-17 | 22-Dec-17 | 15-Dec-17 |
| Production (MBbl/D) | 9.492 | 9.782 | 9.754 | 9.789 |
| Exports (MBbl/D) | 1.015 | 1.475 | 1.210 | 1.858 |
| Crude Inventory | 419.8 | 424.5 | 431.9 | 436.5 |
| Gasoline Inventory | 237.3 | 233.2 | 228.4 | 227.8 |
- EIA Weekly report reported 4.95 million barrels drawdown with stock at 419.8 million barrels on 5th January 2018, against a market expectation of 3.89 million barrels drawdown.
- Gasoline inventories at 237.3 million barrels reported on 5th January 2018, 4.13 million barrels build up against a market expectation of 2.62 million barrels buildup.
Natural Gas
- Henry Hub gas prices remained bullish throughout the week due to cold weather, especially bomb cyclone along with higher inventory draw down number from EIA.
- Baker Hughes reported an increase in gas rigs by 5 and total number stands at 187.
- EIA reported working gas in storage is 2,767 BCF as of Friday, 5th January 2018, net decrease of 359 BCF, largest withdrawal ever, with market expectation of 318 BCF decline.
- CME Henry Hub future on Friday closed at $3.208/MMBTU for February, $2.988/MMBTU for March and $2.782/MMBTU for April, overall depicting bullish run due to cold weather outlook next week.
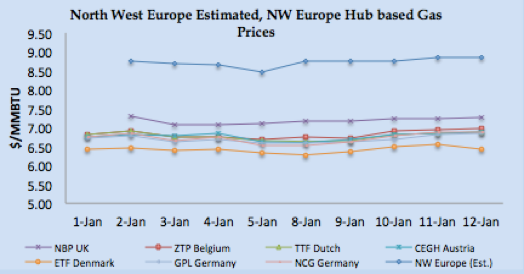
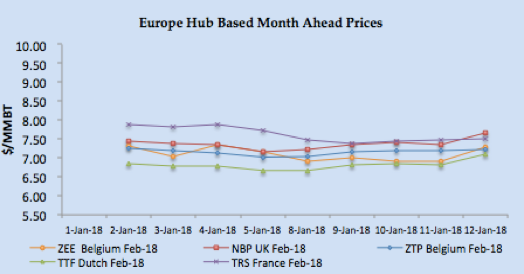
- North West European gas hub prices remained stable to bullish throughout the week on cold weather spell and expected colder outlook, along with support from bullish crude prices.
- Gas flows from regular from Russia and Norway other than reduced supply to Germany fro Norway due to Kristin gas field corrective maintenance, which support bullish run of German gas hub prices.
- Gas Flow into Europe:
| BCFD | Norwegian Gas Flow | Nord Stream | ||||
| Germany | France | Belgium | UK | OPAL | NEL | |
| 30th December – 5th January 2018 | 3.78 | 1.78 | 1.55 | 4.76 | ||
| 6th – 12th January 2018 | 3.98 | 1.80 | 1.57 | 4.83 | 3.73 | 2.24 |
- NBP UK Spot price remained bullish and closed at 52.8830 Pence/Thm ($7.26/MMBTU) on Friday, whereas in the curve market front month February jumped to 55.74 Pence/Thm ($7.69/MMBTU).
- TTF Spot price also remained stable to bullish and closed at €19.2570/MWH ($6.89/MMBTU), whereas front month price closed at €19.840/MWH ($7.10/MMBTU) on Friday.
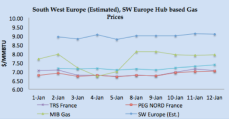
- South West Europe gas hub prices also remained stable due to stable demand from France and Spain despite improvement of nuclear power & hyrdo based generation in France and Spain.
- Spain hydro-based electricity generation increased from last week 4.89 TWH to 5.26 TWH, a still lower number than last year 7.24 TWH.
- Improved nuclear power generation in France, average nuclear power generation increased by approximately 12% from the same time frame last month.
- French Day Ahead prices: PEG Nord closed at €19.620 MWH ($7.02/MMBTU) whereas TRS France closed at €19.667/MWH ($7.04 MMBTU) on Friday.
- Italian PSV jumped to €20.600/MWH ($7.37/MMBTU) and Spain at €22.16/MWH ($7.93/MMBTU).
- Front month prices for February remained stable to bullish with PEG Nord closed at €20.250/MWH ($7.24/MMBTU), TRS at €21.025/MWH ($7.52/MMBTU), PSV at €21.803/MWH ($7.38/MMBTU) on Friday, whereas Iberian prices at €23.33/MWH ($8.35/MMBTU).
Weekly European Gas and LNG quantities at Storage and LNG terminals (BCF)
One standard size Vessel of 150,000 m3 equals to 3.42 BCF.
| Quantity in BCF | 12-Jan-2018 | 5-Jan-2018 | 29-Dec-17 | 22-Dec-17 | |
| Belgium | Gas | 10.34 | 12.47 | 13.00 | 14.15 |
| LNG | 3.48 | 1.38 | 2.18 | 2.67 | |
| Total | 13.82 | 13.85 | 15.18 | 16.83 | |
| Capacity Utilization | 36% | 36% | 39% | 44% | |
| France | Gas | 212.06 | 229.81 | 238.07 | 248.43 |
| LNG | 16.99 | 19.39 | 17.19 | 18.09 | |
| Total | 229.05 | 249.19 | 255.25 | 266.53 | |
| Capacity Utilization | 47% | 51% | 52% | 55% | |
| Germany | Gas | 491.25 | 518.29 | 528.60 | 542.79 |
| LNG | – | – | – | – | |
| Total | 491.25 | 518.29 | 528.60 | 542.79 | |
| Capacity Utilization | 62% | 65% | 67% | 68% | |
| Greece | Gas | – | – | – | – |
| LNG | 1.30 | 2.59 | 1.74 | 1.36 | |
| Total | 1.30 | 2.59 | 1.74 | 1.36 | |
| Capacity Utilization | 48% | 96% | 65% | 51% | |
| Italy | Gas | 451.37 | 472.50 | 490.17 | 506.20 |
| LNG | 5.89 | 6.56 | 1.56 | 3.53 | |
| Total | 457.26 | 479.06 | 491.73 | 509.73 | |
| Capacity Utilization | 68% | 72% | 74% | 76% | |
| Lithuania | Gas | – | – | – | – |
| LNG | 2.76 | 2.79 | 2.93 | 3.09 | |
| Total | 2.76 | 2.79 | 2.93 | 3.09 | |
| Capacity Utilization | 80% | 81% | 85% | 90% | |
| Netherlands | Gas | 253.81 | 276.97 | 287.84 | 302.31 |
| LNG | 4.27 | 4.54 | 4.69 | 5.49 | |
| Total | 258.08 | 281.52 | 292.53 | 307.80 | |
| Capacity Utilization | 57% | 62% | 64% | 68% | |
| Poland | Gas | 82.73 | 86.59 | 88.47 | 89.52 |
| LNG | 5.74 | 2.50 | 3.85 | 4.90 | |
| Total | 88.46 | 89.09 | 92.32 | 94.42 | |
| Capacity Utilization | 74% | 74% | 77% | 79% | |
| Portugal | Gas | 6.23 | 6.94 | 6.41 | 5.50 |
| LNG | 7.03 | 6.87 | 2.13 | 3.46 | |
| Total | 13.26 | 13.81 | 8.54 | 8.96 | |
| Capacity Utilization | 66% | 68% | 42% | 44% | |
| Spain | Gas | 74.29 | 75.36 | 75.44 | 75.58 |
| LNG | 37.56 | 32.12 | 29.64 | 30.29 | |
| Total | 111.85 | 107.48 | 105.08 | 105.87 | |
| Capacity Utilization | 63% | 61% | 60% | 60% | |
| UK | Gas | 26.06 | 27.37 | 20.00 | 12.84 |
| LNG | 20.37 | 25.75 | 29.87 | 25.88 | |
| Total | 46.42 | 53.12 | 49.88 | 38.72 | |
| Capacity Utilization | 69% | 79% | 74% | 58% | |
LNG Price Assessment and Natural Gas 1st – 12th January 2018
 |
 |
 |
 |
 |
 |
LNG Analysis
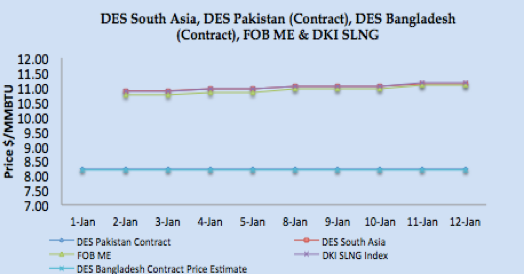
- Asian LNG prices dictating global LNG price, had a bullish run through out the week and heard touching $11.50/MMBTU level at the time of reporting this report.
- Bullish run is supported by prevailing severe cold weather in North East Asia, crude price northward movement, inquiries from India, reduced feed gas supply to Sabine Pass, limited cargo availability for February and production issue at Angola LNG.
- Asian price closures on Friday; SLNG NEA Delivered at $11.356/MMBTU and FOB Singapore at $10.976/MMBTU.
- JKM Future curve market remained bullish with front month expiring at $11.215/MMBTU, & new front month March 2018 closed at $10.30/MMBTU on Friday.
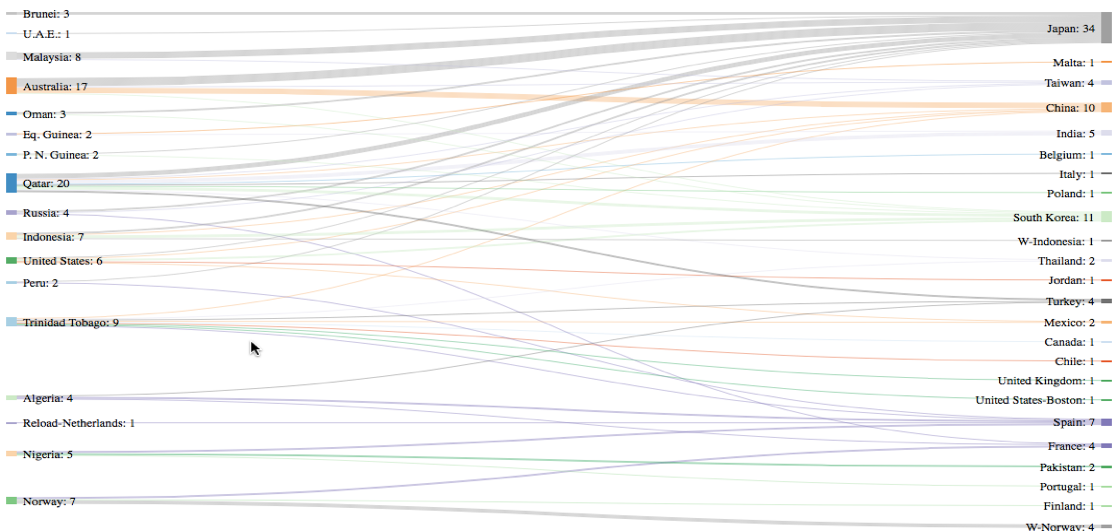
- Japan received 2.13 MMT (34 vessels), S. Korea 0.71 MMT (11 vessels), China 0.75 MMT (10 vessels), and Taiwan 0.26 MMT (4 vessels) during the week.
- MTD import figures for Japan at 3.60 MMT (59 vessels), South Korea 2.19 MMT (32 vessels) & China at 2.08 MMT (27 vessels), highlighting enhanced LNG procurement from Japan and Korea on cold weather.
- Based upon FOB Singapore and Middle East, DES South Asia is calculated around $11.13/MMBTU level, DKI SLNG Index on Friday reported at $11.15/MMBTU.
- India imported 0.372 MMT (5 vessels) last week, while Pakistan received 0.140 MMT (2 vessels) during the week.
- North West European LNG prices taking direction from Asian prices & cold weather outlook remained bullish through out the week.
- North West Europe LNG prices estimated at around $9.00/MMBTU level based upon Asian prices and premium on NBP February price.
- South West Europe LNG prices also got the direction from Asian prices and demand from Spanish market due to colder weather outlook.
- Based upon Iberian Peninsula gas hub price, PEG Nord, TRS and PSV along with Asian prices, South Western Europe prices are estimated between $9.00-$9.10/MMBTU.
- Spain received 7, France received 4, while Poland, Italy, Belgium & UK received one cargo each. Turkey received 4 vessels while Canaport, Canada received one cargo during the week.
- Four reloads, two from France, one for South Korea and UK each left during the week with 4 cargoes destined for Japan.
- Due to increase in Asian prices, arbitrage window is opened for European LNG terminal as netback price is coming between $8.85/MMBTU-$9.10/MMBTU.
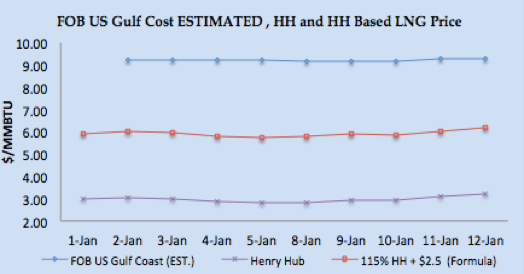
- US Gulf Coast producer price on FOB basis for January delivery for Asian destination comes around $9.26/MMBTU level, for NW European destinations the netback comes around $7.90/MMBTU level and for SW Europe its around $8.14/MMBTU.
- US Henry Hub based price is coming around $6.18/MMBTU on Friday for US based liquefaction companies, which translate into margin of $3.08 /MMBTU for Asian destination, $2.01/MMBTU for NW Europe and $1.96/MMBTU for SW Europe.
- Three cargoes left from Sabine Pass export terminal during the week.
- Current NEA price around $11.50/MMBTU level is estimated to be 18.70% of Brent 3-0-1 basis.
Author’s Comments
- Crude prices touched three years high, and fundamentals supporting last week were oil rig number and production number reduction, going forward with increase in oil rig number and keeping in view other factors like OPEC production cut and vague US stance on Iran nuclear sanctions, I believe there is going to be profit taking and price correction.
- European gas hub prices remain stable to bullish but at lower level due to regular pipeline supply from Russia and Norway, LNG prices are being dictated by Asian prices and so arbitrage is resulting into reload from European terminals.
- LNG price is expected to remain bullish due limited supply availability for February along with colder weather, we expect bullish run to continue for next week due to interest from Japanese and Chinese buyers, Indian and Pakistani buyers are not keen in buying at this level specially when March prices are expected to move southward, overall LNG pricing almost at it celling level for February cargoes
LNG Trade Flows (6th – 12th January 2018)
LNG merchant data is developed in collaboration with Clipper Data LLC, due to Thanks Giving holidays, 24th November data will be shared with next week report)
SUPPLY – TRADE FLOWS
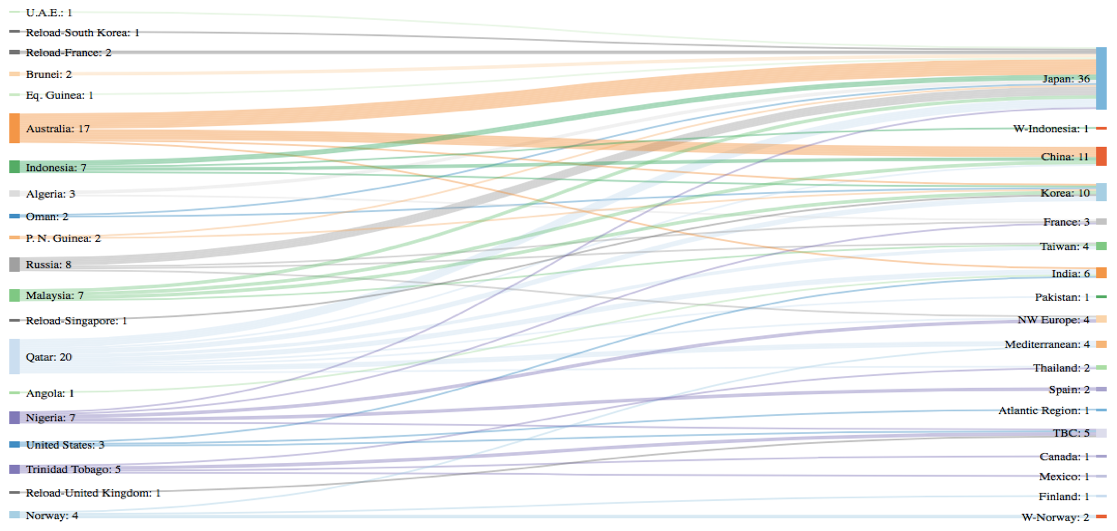
95 vessels carrying 6.36 million tons (305.77 BCF) left supply terminal centres between 6th– 12th January 2018.
DEMAND – TRADE FLOWS
101 vessels carrying 6.47 million tons (310.85 BCF) discharged at various demand centres during same time period.
W-Country- within same country delivery & TBC – To Be Communicated
Disclaimer: This is a personal analysis based on public information and should not be used for buying and selling of commodities. Source: SGX LNG Index Group, EIA, GIE, and Reuters.