Market Analysis
Weather
- North West Europe: Cold weather still prevailing, however, the weather is around the seasonal upper limit.
- South West Europe: Mild weather with the same outlook for next week.
- South America: Still warm with warmer weather outlook.
- Middle East: Mild weather prevailing in the Middle East.
- South Asia: Winter in full swing in India, Pakistan, and Bangladesh.
- North East Asia: Extreme cold weather for China, Japan & South Korea, whereas Taiwan still warm.
- South East Asia: Warm weather still prevailing.
- North America: Mexico in mild to warm weather, whereas cold weather prevailed last week in US with exception of South West and South East, warmer outlook for East and West for next week.
Crude Oil
- Crude oil had a bullish run in the first week of 2018 based upon news on protests in Iran, Geo political tension with North Korea and significant inventory draw down data from US despite resumption of supplies from Forties and Libya.
- Brent prices closed on $67.62/BBL on Friday, while WTI closed at $61.44/BBL.
- Future market closure on Friday for Brent front month (March 2018) at $68.07/BBL, whereas WTI front month at $61.59/BBL, still depicting supply demand balance.
- Brent and WTI future still in backwardation in long-term basis, which is depicting oversupply sentiments.
- Baker Hughes oil-rig count reported decrease by 5 and number stayed at 742.
- Brent-WTI spread still healthy and closed at closed at $6.20/BBL on Friday.
- US crude Production, Export & Inventory data;
| Million Barrels (MBbl) | 29-Dec-17 | 22-Dec-17 | 15-Dec-17 | 8-Dec-17 |
| Production (MBbl/D) | 9.782 | 9.754 | 9.789 | 9.780 |
| Exports (MBbl/D) | 1.475 | 1.210 | 1.858 | 1.086 |
| Crude Inventory | 424.5 | 431.9 | 436.5 | 443.0 |
| Gasoline Inventory | 233.2 | 228.4 | 227.8 | 226.5 |
- EIA Weekly report reported 7.4 million barrels draw down with stock at 425.4 million barrels on 29th December 2017, against a market expectation of 5.15 million barrels draw down.
- Gasoline inventories at 233.2 million barrels reported on 29th December 2017, 4.8 million barrels build up against a market expectation of 2.2 million barrels buildup.
Natural Gas
- Henry Hub prices started bullish due to severe cold weather outlook till Wednesday and then eased of on warmer weather outlook in East and West regions along with smaller than expected inventory drawn down.
- Baker Hughes reported decease in gas rigs by 2 since 24th December 2017 and total number stands at 182.
- EIA reported working gas in storage is 3,126 BCF as of Friday, 5th January 2018, net decrease of 206 BCF, with market expectation of 210 BCF decline.
- CME Henry Hub future on Friday closed at $2.795/MMBTU for February, $2.745/MMBTU for March and $2.650/MMBTU for April, overall bearish outlook on weather-based demand.
- North West European gas hub remained bearish due to warmer weather outlook, adequate inventory level at Gas storage & LNG terminal and regular flow from Norway.
- As per GASCO data, pipeline gas flow reduced for Germany & UK for a day or so due to minor issues at Kvitebjorn and Oseberg, whereas Valemon condensate reduction issue resolved, average flows are given below;
| BCFD | Germany | France | Belgium | UK |
| 23rd – 29th December 2017 | 3.80 | 1.80 | 1.53 | 4.80 |
| 30th December – 4th January 2018 | 3.78 | 1.78 | 1.55 | 4.76 |
- NBP UK Spot price plunged to 52.3622 Pence/Thm ($7.10/MMBTU) on Friday, decreased by 5.62% from last Friday, whereas in the curve market front month February closed at 52.83 Pence/Thm ($7.17/MMBTU).
- TTF Spot price along moved south with Friday closure at €18.866/MWH (equivalent of $6.65/MMBTU) whereas front month price closed at €18.918/MWH ($6.67/MMBTU) on Friday.
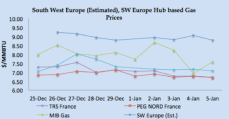
- South West Europe gas hub prices also impact by warmer weather outlook along with improved wind, nuclear & hydro based power generation in France & Spain respectively, overall SW Europe price are dictated by Spanish gas hub prices.
- Spain hydro-based electricity generation increased from last week 4.76 TWH to 4.89 TWH, still lower number than last year 7.24 TWH.
- Improved nuclear power generation in France, average nuclear power generation increased by approximately 8% from the same time frame last month.
- French Day Ahead prices: PEG Nord closed at €19.005 MWH ($6.70/MMBTU) whereas TRS France closed at €19.027/MWH ($6.71 MMBTU) on Friday.
- Italian PSV closed at €20.046/MWH ($7.07/MMBTU) and Spain at €21.50/MWH ($7.58/MMBTU).
- Front month prices for February remained bearish with PEG Nord closed at €19.400/MWH ($6.84/MMBTU), TRS at €21.950/MWH ($7.74/MMBTU), PSV at €20.929/MWH ($7.38/MMBTU) on Friday, whereas Iberian prices at €23.50/MWH ($8.29/MMBTU).
Weekly European Gas and LNG quantities at Storage and LNG terminals (BCF)
One standard size Vessel of 150,000 m3 equals to 3.42 BCF.
| Quantity in BCF | 5-Jan-2018 | 29-Dec-17 | 22-Dec-17 | 15-Dec-17 | |
| Belgium | Gas | 12.47 | 13.00 | 14.15 | 17.40 |
| LNG | 1.38 | 2.18 | 2.67 | 3.15 | |
| Total | 13.85 | 15.18 | 16.83 | 20.55 | |
| Capacity Utilization | 36% | 39% | 44% | 53% | |
| France | Gas | 229.81 | 238.07 | 248.43 | 263.04 |
| LNG | 19.39 | 17.19 | 18.09 | 16.60 | |
| Total | 249.19 | 255.25 | 266.53 | 279.64 | |
| Capacity Utilization | 51% | 52% | 55% | 57% | |
| Germany | Gas | 518.29 | 528.60 | 542.79 | 581.66 |
| LNG | – | – | – | – | |
| Total | 518.29 | 528.60 | 542.79 | 581.66 | |
| Capacity Utilization | 65% | 67% | 68% | 73% | |
| Greece | Gas | – | – | – | – |
| LNG | 2.59 | 1.74 | 1.36 | 2.68 | |
| Total | 2.59 | 1.74 | 1.36 | 2.68 | |
| Capacity Utilization | 96% | 65% | 51% | 100% | |
| Italy | Gas | 472.50 | 490.17 | 506.20 | 530.59 |
| LNG | 6.56 | 1.56 | 3.53 | 3.85 | |
| Total | 479.06 | 491.73 | 509.73 | 534.44 | |
| Capacity Utilization | 72% | 74% | 76% | 80% | |
| Lithuania | Gas | – | – | – | – |
| LNG | 2.79 | 2.93 | 3.09 | 2.11 | |
| Total | 2.79 | 2.93 | 3.09 | 2.11 | |
| Capacity Utilization | 81% | 85% | 90% | 61% | |
| Netherlands | Gas | 276.97 | 287.84 | 302.31 | 324.31 |
| LNG | 4.54 | 4.69 | 5.49 | 5.64 | |
| Total | 281.52 | 292.53 | 307.80 | 329.94 | |
| Capacity Utilization | 62% | 64% | 68% | 73% | |
| Poland | Gas | 86.59 | 88.47 | 89.52 | 93.55 |
| LNG | 2.50 | 3.85 | 4.90 | 1.58 | |
| Total | 89.09 | 92.32 | 94.42 | 95.13 | |
| Capacity Utilization | 74% | 77% | 79% | 79% | |
| Portugal | Gas | 6.94 | 6.41 | 5.50 | 5.98 |
| LNG | 6.87 | 2.13 | 3.46 | 2.98 | |
| Total | 13.81 | 8.54 | 8.96 | 8.95 | |
| Capacity Utilization | 68% | 42% | 44% | 44% | |
| Spain | Gas | 75.36 | 75.44 | 75.58 | 76.77 |
| LNG | 32.12 | 29.64 | 30.29 | 30.86 | |
| Total | 107.48 | 105.08 | 105.87 | 107.63 | |
| Capacity Utilization | 61% | 60% | 60% | 61% | |
| UK | Gas | 27.37 | 20.00 | 12.84 | 15.86 |
| LNG | 25.75 | 29.87 | 25.88 | 27.62 | |
| Total | 53.12 | 49.88 | 38.72 | 43.48 | |
| Capacity Utilization | 79% | 74% | 58% | 65% | |
LNG Price Assessment and Natural Gas 11th – 22nd December 2017
 |
 |
 |
 |
|
 |
LNG Analysis
- LNG Prices remained stable to bullish globally taking the lead from Asian prices due to enhanced spot demand from China, Korea, Japan and India due to cold weather along with cold blizzard in East Coast US.
- Extreme cold weather in Central, Eastern & Northern China has paralyzed the life and demand for heating has increased, which may result in switching to coal based heating.
- Cargo availability seems adequate after Gorgon and Wheatstone resumption from maintenance.
- Indian buyers Petronet and Gail finalized tender this week, whereas Bharat Petroleum has issued a tender for end February delivery.
- India imported 0.411 MMT (6 vessels) last week, while Pakistan received 0.136 MMT (two vessels) for the same period.
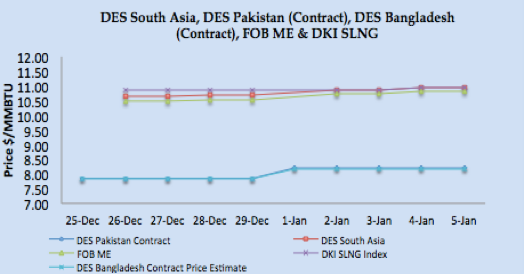
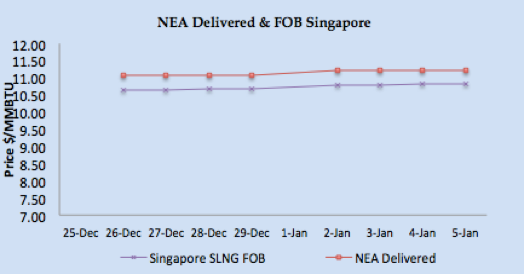
- Asian price closures on Friday; SLNG NEA Delivered at $11.23/MMBTU and FOB Singapore at $10.83/MMBTU.
- Based upon FOB Singapore and Middle East, DES South Asia is calculated around $10.94/MMBTU level, DKI SLNG Index on Friday reported at $10.94/MMBTU.
- JKM Future curve market remained bullish with front month at $11.700/MMBTU along with $9.825/MMBTU & $7.65/MMBTU for March & April 2018 respectively; February 2018 is going to be peak demand season.
- Japan received 1.47 MMT (25 vessels), S. Korea 1.48 MMT (21 vessels), China 1.33 MMT (17 vessels), and Taiwan 0.336 MMT (6 vessels) during the week.
- December 2017 import figures for China stands at 5.0 MMT, making China second largest LNG importer in December 2017 after Japan.
- North West European LNG prices remained bearish due to warmer weather outlook along with adequate pipeline gas supply.
- North West Europe LNG prices closed at around $8.50/MMBTU, premium on February NBP prices.
- South West Europe LNG prices also had a bearish run due to improvement of availability from nuclear and hydro based power generation in France and Spain.
- Based upon Iberian Peninsula gas hub price, PEG Nord, TRS and PSV along with Asian prices, South Western Europe prices are estimated between $8.80-$9.00/MMBTU.
- France & Spain received three cargoes during the week, while Italy & Greece received two cargoes and one each for UK, Portugal, Netherlands and Sweden, while Turkey received 4 vessels.
- Two reloads cargoes despatched, one each from Belgium and Netherlands, while this week 5 reload cargoes received, three from France, One from UK and Belgium at the ports of China, Turkey and Sweden.
- At the time of writing the report, next one week vessel arrival numbers are; Japan 30, S Korea 11, China 9, India 7, Taiwan 4 and Turkey 2. Last two weeks Korean imports have been higher than China.
- Due to increase in Asian prices, arbitrage window is opened for European LNG terminal as netback price is coming between $9.00/MMBTU-$9.50/MMBTU.
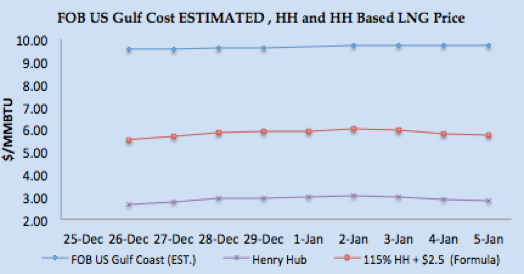
- US Gulf Coast producer price on FOB basis for January delivery for Asian destination comes around $9.73/MMBTU level, for NW European destinations the netback comes around $7.72/MMBTU level and for SW Europe its around $8.04/MMBTU.
- US Henry Hub based price is coming around $5.71/MMBTU for US based liquefaction companies, which translate into margin of $3.52 /MMBTU for Asian destination, $2.00/MMBTU for NW Europe and $2.33/MMBTU for SW Europe.
- Current NEA price of $11.23/MMBTU level is estimated to be 18.25% of Brent 3-0-1 basis.
Author’s Comments
- Current bullish rally on crude on the basis of Iranian tension doesn’t seem to hold for long and market seems to be long especially after resolution of issues at Forties and Libyan pipeline. Crude may get support for an oil- rig count reduction, however overall sentiments seems to be bearish.
- Natural gas prices in Europe remained bearish and have not been able to impact LNG prices, overall outlook for net week seems bearish as pipelined gas supply are regular along with inventory level at comfortable level across Europe along and warmer weather outlook. Any bearish sentiments on crude may also push prices southward, and arbitrage is open for Asian and South Asian location from European LNG terminals.
- Cold weather in North East Asia is dictating the demand and prices, looking at weather forecast, we believe LNG prices will remain bullish next week as China is expected to keep buying for January and February deliveries and reload from Europe are also fuelling the price sentiments.
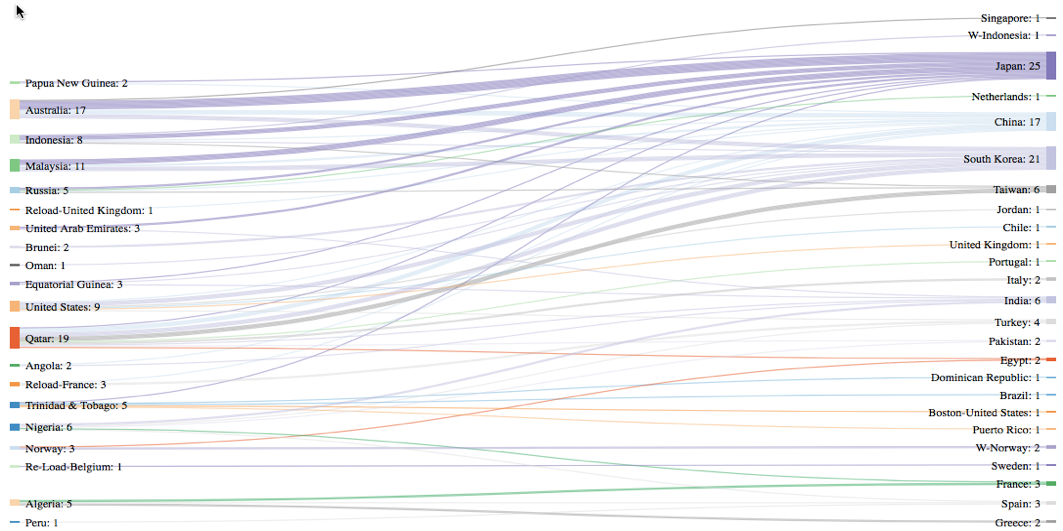
LNG Trade Flows (30th December 2017 – 5th January 2018)
LNG merchant data is developed in collaboration with Clipper Data LLC, due to Thanks Giving holidays, 24th November data will be shared with next week report)
SUPPLY – TRADE FLOWS
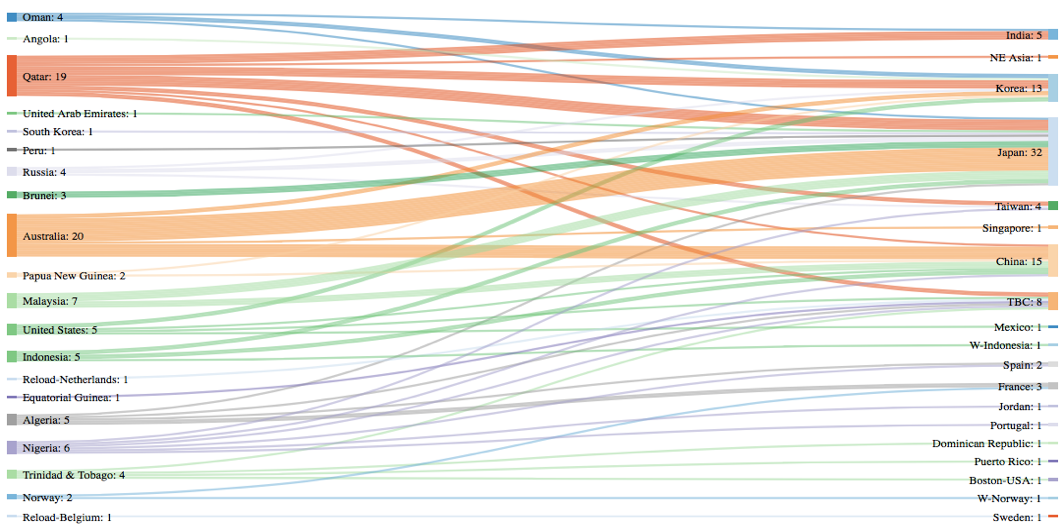
DEMAND – TRADE FLOWS
W-Country- within same country delivery & TBC – To Be Communicated
- 93 vessels carrying 6.50 million tons (312.06 BCF) departed, supply ports between 30th December 2017 & 5th January 2018.
- 107 vessels carrying 6.85 million tons (328.91 BCF) discharged at various demand centres during same time period.
Disclaimer: This is a personal analysis based on public information and should not be used for buying and selling of commodities. Source: SGX LNG Index Group, EIA, GIE, and Reuters.