Market Analysis
Weather
- North West Europe: Cold weather with colder weather outlook for next week.
- South West Europe: Mild cold weather with an outlook for colder weather especially in France and Spain.
- South America: Same as last week with mild weather in Argentina & warm weather in the remaining region.
- Middle East: Still enjoying the mild weather.
- South Asia: India and Pakistan mild to cold weather, with the same outlook for next week.
- North East Asia: Japan, South Korea and China still under severe cold weather, with the same outlook for next week, while Taiwan is still enjoying mild weather.
- South East Asia: Within the seasonal limits of warm weather with the same outlook.
- North America: Mexico still inching towards warm weather, for US same profile as last week, cold weather in the Northern Rockies, Midwest and North East, while mild weather in West & Southwest, Southeast and South, and this will continue for next week.
Crude Oil
- In comparison with last week, crude oil prices had a bearish run during the week due to increase in oil rigs, enhanced US production, fluctuating US dollar despite positive news on OPEC production cut compliance.
- EIA reported increased in crude inventory, however, the bearish sentiments were countered by drawdown on gasoline inventories. Refineries operating rate decreased to 88.10% from previous week of 90.90%.
- OPEC compliance is being adhered, as big suppliers are not increasing their production, however, reduction is also attributed to production fall from Venezuela, production has plunged by 216,000 BPD in December 2017.
- JP Morgan and Goldman Sachs has revised their price forecast with JP Morgan forecast is for $70/BBL, while Goldman Sachs forecasted $75/BBL for three months & $82.50/BBL for 6 months, however wary of second half due to expected enhanced production from drillers in US.
- US Dollar Index remained weak, however on Friday regained some control and closed at 89.17, which has resulted in Crude prices southward movement.
- Inventory in Cushing at 37.0 million barrels, down by 2.4 million barrels from last week and still supporting WTI prices.
- Brent prices closed on $68.58/BBL on Friday, while WTI closed at $65.45/BBL, with Brent-WTI spread shrinking to $3.13/BBL on Friday.
- Future market closure on Friday for Brent front month at $69.65/BBL, with $69.35/BBL & $69.02/BBL for May & June, whereas WTI front month (Mar) at $65.06/BBL, $64.68/BBL for April & $64.19/BBL for May.
- Brent backwardation is based upon market confidence on OPEC production cut, while WTI futures backwardation is due to lower inventory at Cushing. Long-term outlook is still bearish, as market believes enhanced production from US.
- Baker Hughes oil-rig count reported an increase by 6 and total oil-rigs number at 765.
- US crude production increased by 41,000 Barrel during the week, US Production, Export & Inventory data;

| Million Barrels (MBbl) | 26-Jan-2018 | 19-Jan-2018 | 12-Jan-2018 | 05-Jan-2018 |
| Production (MBbl/D) | 9.919 | 9.878 | 9.750 | 9.492 |
| Exports (MBbl/D) | 1.765 | 1.411 | 1.249 | 1.015 |
| Crude Inventory | 418.4 | 411.6 | 412.7 | 419.8 |
| Gasoline Inventory | 242.1 | 244.0 | 240.9 | 237.3 |
- EIA Weekly report reported 6.78 million barrels build up with stock at 418.4 million barrels on 26th January 2018, against a market expectation of 0.13 million barrels buildup.
- Gasoline inventories at 242.10 million barrels reported on 26th January 2018, surprised 1.98 million barrels drawdown against a market expectation of 1.81 million barrels buildup.
Natural Gas
- Henry Hub gas prices had bearish run primarily due to lower than expected inventory drawdown along with front month conversion into delivery and March taking over as front month, despite colder than normal range weather in Northern Rockies, Midwest and Northeast regions.
- Historically January has always been a peak pricing month and prices east after January so that sentiments also prevailing in the market.
- EIA reported working gas in storage is 2,197 BCF as of Friday, 26th January 2018, a net decrease of 99 BCF, lower than market expectation of 107 BCF drawdown.
- Baker Hughes reported a decrease in gas rigs by 7 and total number stands at 181.
- Henry Hub closure on Friday was $2.85/MMBTU, whereas the future market closures were $2.86/MMBTU for March, $2.81/MMBTU for April & $2.82/MMBTU for May, depicting post January weather based easing.

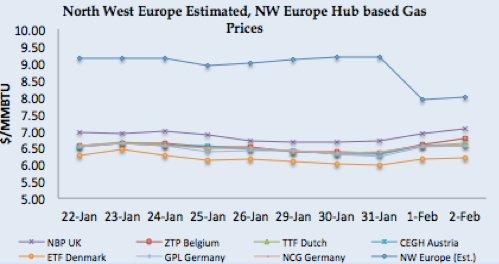
- North West European gas hub prices remained had a bearish run at the start of the week, however colder weather outlook for next week along with low wind based power generation has brought bullishness in Day Ahead and curve markets both.
- Flow from Russia and Norway remained adequate except for 30th January 2018 when due to 24 hours shutdown of the gas processing plant at Nyhama, which resulted in a reduction of flows to UK, Germany & Belgium.
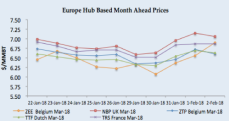
- NBP UK Spot price jumped to 49.90 Pence/Thm ($7.05/MMBTU) on Friday, along with front month March jumped to 49.90 Pence/Thm ($7.05/MMBTU).
- TTF Spot price also jumped at €18.18/MWH ($6.63/MMBTU), 2.0% increase from last Friday, whereas front month (March) price closed at €18.17/MWH ($6.63/MMBTU) on Friday.
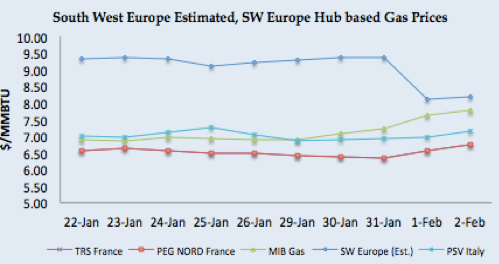
- South West Europe gas hub prices got support from colder weather in France and Spain during the week and colder weather outlook with improved nuclear power & hyrdo based generation in France and Spain prevailing.
- Spain hydro-based electricity generation increased from last week 5.39 TWH to 5.44 TWH, still lower number than last year 6.38 TWH.
- French Day Ahead prices: PEG Nord closed at €18.53 MWH ($6.76/MMBTU) whereas TRS France also closed at €18.53/MWH ($6.76 MMBTU) on Friday, increased by $0.67/MMBTU from last week.
- Italian PSV closed at €19.52/MWH ($7.16/MMBTU) and Iberian Day Ahead price jumped to €21.34/MWH ($7.79/MMBTU).
- Front month changed from February to March and had a bullish run, with PEG Nord closed at €18.36/MWH ($6.70/MMBTU), TRS France at €18.80/MWH ($6.86/MMBTU), PSV at €19.87/MWH ($7.25/MMBTU) on Friday, whereas Iberian forward price last deal was on Thursday at €20.65/MWH ($7.56/MMBTU).
Weekly European Gas and LNG quantities at Storage and LNG terminals (BCF)
One standard size Vessel of 150,000 m3 equals to 3.42 BCF.
| Quantity in BCF | 02-Feb-2018 | 26-Jan-18 | 19-Jan-18 | 12-Jan-18 | |
| Belgium | Gas | 7.44 | 8.18 | 9.46 | 10.34 |
| LNG | 2.09 | 2.46 | 2.97 | 3.48 | |
| Total | 9.53 | 10.64 | 12.44 | 13.82 | |
| Capacity Utilization | 25% | 28% | 32% | 36% | |
| France | Gas | 152.13 | 172.61 | 191.95 | 212.06 |
| LNG | 12.69 | 19.33 | 16.80 | 16.99 | |
| Total | 164.82 | 191.93 | 208.75 | 229.05 | |
| Capacity Utilization | 34% | 39% | 43% | 47% | |
| Germany | Gas | 417.46 | 435.77 | 457.57 | 491.25 |
| LNG | – | – | – | – | |
| Total | 417.46 | 435.77 | 457.57 | 491.25 | |
| Capacity Utilization | 53% | 55% | 58% | 62% | |
| Greece | Gas | – | – | – | – |
| LNG | 1.21 | 2.39 | 2.23 | 1.30 | |
| Total | 1.21 | 2.39 | 2.23 | 1.30 | |
| Capacity Utilization | 45% | 89% | 83% | 48% | |
| Italy | Gas | 369.62 | 396.47 | 423.54 | 451.37 |
| LNG | 6.04 | 5.52 | 4.95 | 5.89 | |
| Total | 375.66 | 401.99 | 428.49 | 457.26 | |
| Capacity Utilization | 56% | 60% | 64% | 68% | |
| Lithuania | Gas | – | – | – | – |
| LNG | 1.92 | 2.16 | 2.58 | 2.76 | |
| Total | 1.92 | 2.16 | 2.58 | 2.76 | |
| Capacity Utilization | 56% | 63% | 75% | 80% | |
| Netherlands | Gas | 191.45 | 209.83 | 230.37 | 253.81 |
| LNG | 3.62 | 3.87 | 4.15 | 4.27 | |
| Total | 195.07 | 213.70 | 234.52 | 258.08 | |
| Capacity Utilization | 43% | 47% | 52% | 57% | |
| Poland | Gas | 68.66 | 71.90 | 77.01 | 82.73 |
| LNG | 3.47 | 4.40 | 5.05 | 5.74 | |
| Total | 72.13 | 76.31 | 82.06 | 88.46 | |
| Capacity Utilization | 60% | 64% | 68% | 74% | |
| Portugal | Gas | 6.30 | 6.32 | 6.16 | 6.23 |
| LNG | 5.10 | 5.25 | 7.29 | 7.03 | |
| Total | 11.41 | 11.57 | 13.45 | 13.26 | |
| Capacity Utilization | 56% | 57% | 66% | 66% | |
| Spain | Gas | 72.21 | 73.06 | 73.47 | 74.29 |
| LNG | 30.36 | 31.48 | 34.06 | 37.56 | |
| Total | 102.57 | 104.54 | 107.53 | 111.85 | |
| Capacity Utilization | 58% | 59% | 61% | 63% | |
| UK | Gas | 28.82 | 24.48 | 24.90 | 26.06 |
| LNG | 14.74 | 16.54 | 18.35 | 20.37 | |
| Total | 43.56 | 41.02 | 43.26 | 46.42 | |
| Capacity Utilization | 65% | 61% | 64% | 69% | |
LNG Price Assessment and Natural Gas 15th – 26th January 2018
 |
 |
 |
 |
 |
 |
LNG Analysis
- Global LNG price with March as the delivery month seems steady to bearish, as severe weather in Japan, South Korea and China has put pressure on prompt delivery cargoes.
- Demand is strong for 2H delivery and early March cargoes, whereas 2H March prices seem to be easing up as its mark end of winter season.
- January 2018 import data depicts 8.64 million tons delivery to Japan, higher than 7.37 million tons in December 2017, whereas China imported 5.28 million tons, higher than 5.0 million tons in December 2017.
- Supply seems adequate with additional supply after commissioning of Cove Point will have a bearish impact on prices.
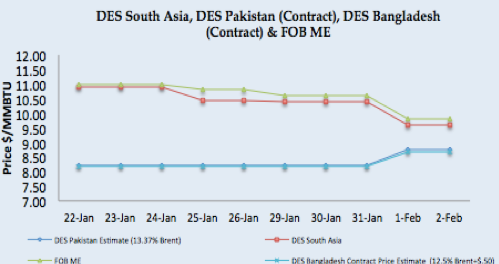
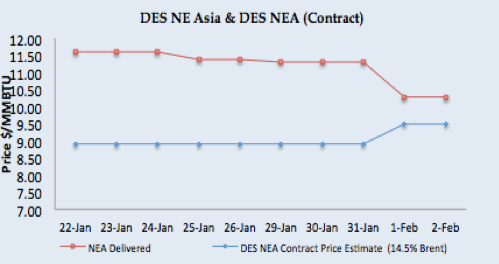
- Asian price closures on Friday; NEA Delivered at $10.30/MMBTU level, while long term contract based prices at $8.74/MMBTU for Pakistan & $9.48/MMBTU for Asian destinations (14.5% Brent based).
- JKM front month (March) with inches upward and closed at $10.35/MMBTU on Friday.
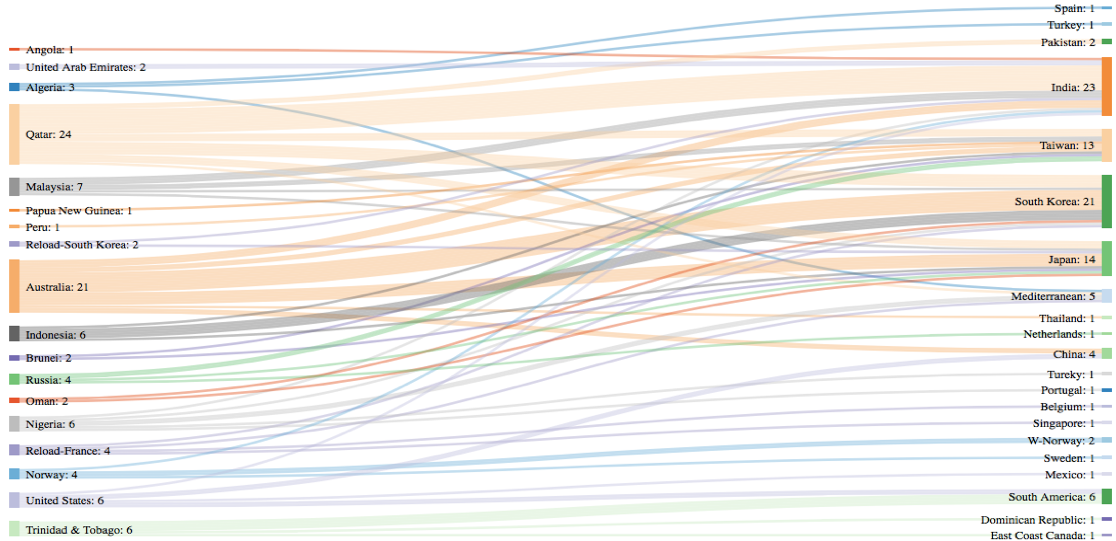
- Japan received 2.06MMT (32 vessels), South Korea 1.11MMT (16 vessels), China 0.98MMT (13 vessels) and Taiwan 0.41MMT (6 vessels) during the week, NEA represents 65.57% of a global trade this week.
- February receipt for 1st two days are: Japan at 0.73MMT (11 vessels), South Korea 0.41MMT (6 vessels), China at 0.05MMT (1 vessel) & none for Taiwan.
- DES South Asia is calculated around $9.36/MMBTU level.
- India imported 0.56MMT (8 vessels), MTD 0.15MMT (2 vessels), while Pakistan received 0.23MMT (3 vessels), two at Engro terminal & one at PGPL terminal during the week, with MTD 0.14MMT (2 vessels).
- North West European LNG prices still dictated due to arbitrage window still open for North East Asian destinations, as supply still is regular from Norway and Russia through pipeline.
- North West Europe LNG prices estimated at around $7.98/MMBTU level based upon Asian prices and still have a premium over NBP UK front month price.
- South West Europe LNG also taking direction from NE Asian prices and closed at $8.15/MMBTU level.
- Spain received 4 & France received 4 while Italy, Belgium & Portugal received one cargo each. Turkey received 4 cargoes during the week.
- Reload cargoes: 4 cargoes left from Spain, two from Montoir, One from Dunkerique and Fos, while two cargoes left Posc-Gwangyang terminal.
- Chile received two cargoes, while Brazil & USA received one cargo each.
- Asian prices still attractive for European terminals with arbitrage window still open with netback price is coming between $8.20/MMBTU-$8.45/MMBTU.
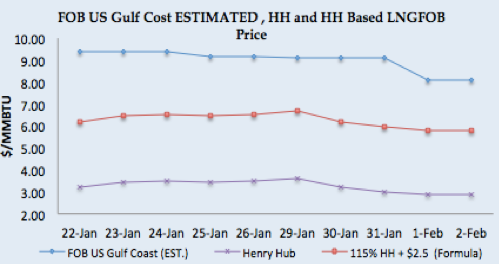
- US Gulf Coast producer price on FOB basis for March delivery for Asian destination comes around $8.09/MMBTU level, still significant margin for US producer, for NW European destinations the netback price comes around $7.03/MMBTU level and for SW Europe its around $7.22/MMBTU, making all three destinations extremely lucrative for the US during winter season.
- US Henry Hub based price is coming around $5.78/MMBTU on Friday for US based liquefaction companies, which translate into a margin of $2.32/MMBTU for Asian destination, $1.35/MMBTU for NW Europe and $1.54/MMBTU for SW Europe.
- Four cargoes left from Sabine Pass export terminal during the week, destined for Korea, Mexico & Mediterranean with one destination yet to be declared.
- Current NEA price around $10.30/MMBTU level is estimated to be 17.75% of Brent 3-0-1 basis down from 18.50% last week due to higher Brent prices along with lower NEA prices.
Author’s Comments
- Crude oil prices are getting support from OPEC sentiments, Venezuela’s reduced production, financial institutions upward revision on crude prices, along with fluctuating US Dollar, however fundamentals in short term and long term are supporting that prices will be steady to bearish as current price level is attracting more drillers to jump with US tax cut in action will further support US oil production. Brent based LNG pricing demand will be low in coming month with focus will be more on spot cargoes.
- Henry Hub price has a bearish run and based upon HH based LNG prices, US liquefaction companies will be making money around $1.70/MMBTU for March 2018, whereas European gas Hub prices are still at discount on LNG offer prices for the European market, with arbitrage still open from European terminal for North East Asian destinations. Overall gas hub prices are not impacting LNG prices.
- Off-season almost ready to kick-start with bullishness is only for February and early March deliveries. Overall supply seems adequate and with Cove point sentiments will further be bearish. Buyers from India and China will now focus on 2H March delivery cargoes. This winter has been extremely positive for US producer and will perhaps bring in a new dimension for US projects to consider by offering long term HH based prices to buyers in South Asia and North East Asian customers.
LNG Trade Flows (27th January – 2nd February 2018)
LNG merchant data is developed in collaboration with Clipper Data LLC, due to Thanks Giving holidays, 24th November data will be shared with next week report)
SUPPLY – TRADE FLOWS
- 102 vessels carrying 7.08 million tons (340.35 BCF) left supply terminal centers between 27th January – 2nd February 2018.
DEMAND – TRADE FLOWS
- 106 vessels carrying 6.95 million tons (334.01 BCF) left supply terminal centers.

Disclaimer: This is a personal analysis based on public information and should not be used for buying and selling of commodities. Source: SGX LNG Index Group, EIA, GIE, and Reuters.