Market Analysis
Weather
- North West Europe: Weather remained cold throughout the week, with easing a bit over the weekend; however next week weather outlook is same.
- South West Europe: Cold weather in France, with mild weather in Italy, Spain and Portugal, next week outlook is weather easing by a couple of degrees.
- South America: Still warm and same outlook for next week.
- Middle East: Best time of the year in Middle East with temperature in mild range.
- South Asia: India, Pakistan and Bangladesh enjoying mild to warm weather with the same outlook for next week.
- North East Asia: Part of Japan, South Korea and China still under severe cold weather with weather easing a bit in the remaining region, Taiwan enjoyed mild weather. Outlook is almost same with less colder cities easing a bit now.
- South East Asia: Still warm weather with same outlook.
- North America: Mexico still inching towards warm weather, still same profile for the US with cold weather in the Northern Rockies, Midwest and North East, while mild weather in West & Southwest, Southeast and South, and this will continue for next week with some rain forecast in South.
Crude Oil
- Crude oil prices plunged, primarily on US production rise, global stock market nose-diving and weekly EIA data on crude inventory, however basically the fundamentals of over supply took over.
- US production touched by 10.25 million barrels a day, setting all time high production number, this will be overwhelming OPEC production cut sentiments.
- Global stock market had a correction week with S&P500, Dow Jones and other stock markets plunged by 10% during the week.
- EIA reported increased in crude inventory & gasoline with refineries operating rate increased to 92.5% from previous week of 88.1%.
- Brent prices decreased by 8.44% since last Friday to $62.79/BBL on Friday, while WTI closed at $659.20/BBL, down by 9.55%, with Brent-WTI spread at $3.59/BBL on Friday.
- Future market closure on Friday for Brent front month at $62.66/BBL, with $62.34/BBL & $62.16/BBL for May & June, whereas WTI front month (Mar) at $59.05/BBL, $58.32/BBL for April & $58.14/BBL for May.
- Long term backwardation for Brent and WTI future markets depicting the fundamental of over supply is back and governing the market.
- Baker Hughes oil-rig count jumped to 791, an increase by 26 in oil-rigs number this week.
- US crude production increased by 332,000 Barrel during the week, US Production, Export & Inventory data;

| Million Barrels (MBbl) | 02-Feb-2018 | 26-Jan-2018 | 19-Jan-2018 | 12-Jan-2018 |
| Production (MBbl/D) | 10.251 | 9.919 | 9.878 | 9.750 |
| Exports (MBbl/D) | 1.287 | 1.765 | 1.411 | 1.249 |
| Crude Inventory | 420.3 | 418.4 | 411.6 | 412.7 |
| Gasoline Inventory | 245.5 | 242.1 | 244.0 | 240.9 |
- EIA Weekly report reported 1.89 million barrels build up with stock at 420.3 million barrels on 2nd February 2018, against a market expectation of 3,19 million barrels buildup.
- Gasoline inventories at 245.50 million barrels reported on 2nd February 2018, increased by 3.414 million barrels build-up against a market expectation of 0.46 million barrels buildup, substantiating increased in refineries operating rates.
Natural Gas
- Henry Hub gas prices had bearish run as the weather factor remained same as last week, with northern US having more heating demand, however the rest of US has lower demand along with bearish crude and stock market along with March outlook has always been a bearish historically.
- EIA reported working gas in storage is 2,078 BCF as of Friday, 2nd February 2018, net decrease of 119 BCF, a bit higher than market expectation of 116 BCF draw down.
- Baker Hughes reported an increase in gas rigs by 3 and total number stands at 184.
- Henry Hub closure on Friday was $2.58/MMBTU, decrease by 9.47% from last week, future market closures were $2.60/MMBTU for March, $2.61/MMBTU for April & $2.64/MMBTU for May.
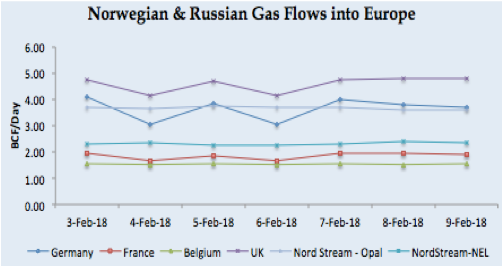
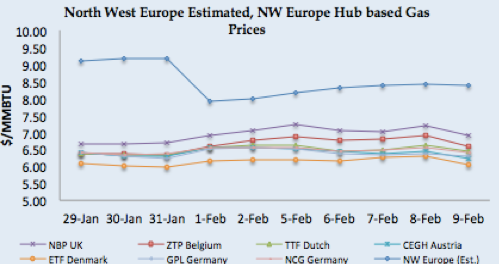
- North West European gas hub prices remained steady through out the week as the weather outlook is bit milder than current week, along with adequate supply from Norwegian and Russian gas pipelines.
- Flow from Russia and Norway remained adequate except for 4th & 6th February 2018 due to minor issues at Kollsness, Traoll and Heimdal areas.

- NBP UK Spot price closed at 50.22 Pence/Thm ($6.92/MMBTU) on Friday, along with front month March jumped to 50.04 Pence/Thm ($6.90/MMBTU).
- TTF Spot price closure at €18.02/MWH ($6.46/MMBTU), whereas front month (March) price closed at €17.91/MWH ($6.42/MMBTU) on Friday.
- South West Europe gas hub prices remained steady to bullish due to cold weather in France along with mild weather in rest of the region plus lower hydro based power generation in Spain, whereas in nuclear-based power generation remained same as last week.
- Spain hydro-based electricity generation decreased a bit from 5.46 TWH to 5.44 TWH, still lower number than last year 7.01 TWH for the same period.
- French Day Ahead prices: PEG Nord closed at €18.76 MWH ($6.72/MMBTU) whereas TRS France also closed at €18.79/MWH ($6.74 MMBTU) on Friday.
- Italian PSV closed at €19.38/MWH ($7.13/MMBTU) and Iberian Day Ahead price jumped to €22.62/MWH ($8.11/MMBTU).
- Front month PEG Nord closed at €18.31/MWH ($6.56/MMBTU), TRS France at €18.64/MWH ($6.70/MMBTU), PSV at €19.41/MWH ($6.98/MMBTU), whereas Iberian forward price on Friday at €20.35/MWH ($7.29/MMBTU).
Weekly European Gas and LNG quantities at Storage and LNG terminals (BCF)
One standard size Vessel of 150,000 m3 equals to 3.42 BCF.
| Quantity in BCF | 09-Feb-2018 | 02-Feb-2018 | 26-Jan-18 | 19-Jan-18 | |
| Belgium | Gas | 5.79 | 7.44 | 8.18 | 9.46 |
| LNG | 3.93 | 2.09 | 2.46 | 2.97 | |
| Total | 9.72 | 9.53 | 10.64 | 12.44 | |
| Capacity Utilization | 25% | 25% | 28% | 32% | |
| France | Gas | 126.58 | 152.13 | 172.61 | 191.95 |
| LNG | 17.67 | 12.69 | 19.33 | 16.80 | |
| Total | 144.25 | 164.82 | 191.93 | 208.75 | |
| Capacity Utilization | 30% | 34% | 39% | 43% | |
| Germany | Gas | 362.33 | 417.46 | 435.77 | 457.57 |
| LNG | – | – | – | – | |
| Total | 362.33 | 417.46 | 435.77 | 457.57 | |
| Capacity Utilization | 46% | 53% | 55% | 58% | |
| Greece | Gas | – | – | – | – |
| LNG | 1.94 | 1.21 | 2.39 | 2.23 | |
| Total | 1.94 | 1.21 | 2.39 | 2.23 | |
| Capacity Utilization | 72% | 45% | 89% | 83% | |
| Italy | Gas | 344.13 | 369.62 | 396.47 | 423.54 |
| LNG | 5.58 | 6.04 | 5.52 | 4.95 | |
| Total | 349.72 | 375.66 | 401.99 | 428.49 | |
| Capacity Utilization | 52% | 56% | 60% | 64% | |
| Lithuania | Gas | – | – | – | – |
| LNG | 1.90 | 1.92 | 2.16 | 2.58 | |
| Total | 1.90 | 1.92 | 2.16 | 2.58 | |
| Capacity Utilization | 55% | 56% | 63% | 75% | |
| Netherlands | Gas | 162.32 | 191.45 | 209.83 | 230.37 |
| LNG | 2.47 | 3.62 | 3.87 | 4.15 | |
| Total | 164.79 | 195.07 | 213.70 | 234.52 | |
| Capacity Utilization | 36% | 43% | 47% | 52% | |
| Poland | Gas | 64.28 | 68.66 | 71.90 | 77.01 |
| LNG | 1.97 | 3.47 | 4.40 | 5.05 | |
| Total | 66.26 | 72.13 | 76.31 | 82.06 | |
| Capacity Utilization | 55% | 60% | 64% | 68% | |
| Portugal | Gas | 6.04 | 6.30 | 6.32 | 6.16 |
| LNG | 5.97 | 5.10 | 5.25 | 7.29 | |
| Total | 12.01 | 11.41 | 11.57 | 13.45 | |
| Capacity Utilization | 59% | 56% | 57% | 66% | |
| Spain | Gas | 69.26 | 72.21 | 73.06 | 73.47 |
| LNG | 20.93 | 30.36 | 31.48 | 34.06 | |
| Total | 90.19 | 102.57 | 104.54 | 107.53 | |
| Capacity Utilization | 51% | 58% | 59% | 61% | |
| UK | Gas | 21.59 | 28.82 | 24.48 | 24.90 |
| LNG | 12.91 | 14.74 | 16.54 | 18.35 | |
| Total | 34.49 | 43.56 | 41.02 | 43.26 | |
| Capacity Utilization | 51% | 65% | 61% | 64% | |
LNG Price Assessment and Natural Gas 29th January – 9th February 2018
 |
 |
 |
 |
 |
 |
LNG Analysis
- Global LNG prices still taking direction from Asian prices and remained steady to bullish throughout the week due to prevailing buying appetite from Japan, South Korea and China due to severe cold weather with expected tightness in the spot supply due to production issues at Bontang & Ichthys projects.
- Buyers in India and other markets like Pakistan are now eyeing to maximize their procurement from April as prices is expected to be bearish due to off season from winter based demand.
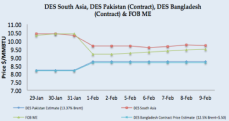
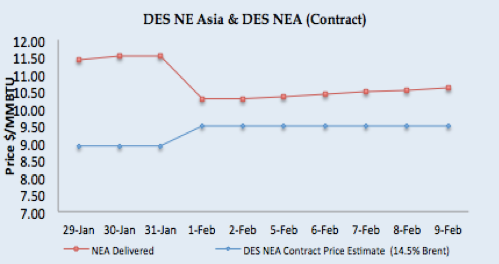
- Asian price closures on Friday; NEA Delivered at $10.59/MMBTU level, while long term contract based prices at $8.74/MMBTU for Pakistan & $9.48/MMBTU for Asian destinations (14.5% Brent based).
- JKM front month (March) with inches upward and closed at $10.47/MMBTU on Friday, whereas April 2018 price at $8.20/MMBTU.
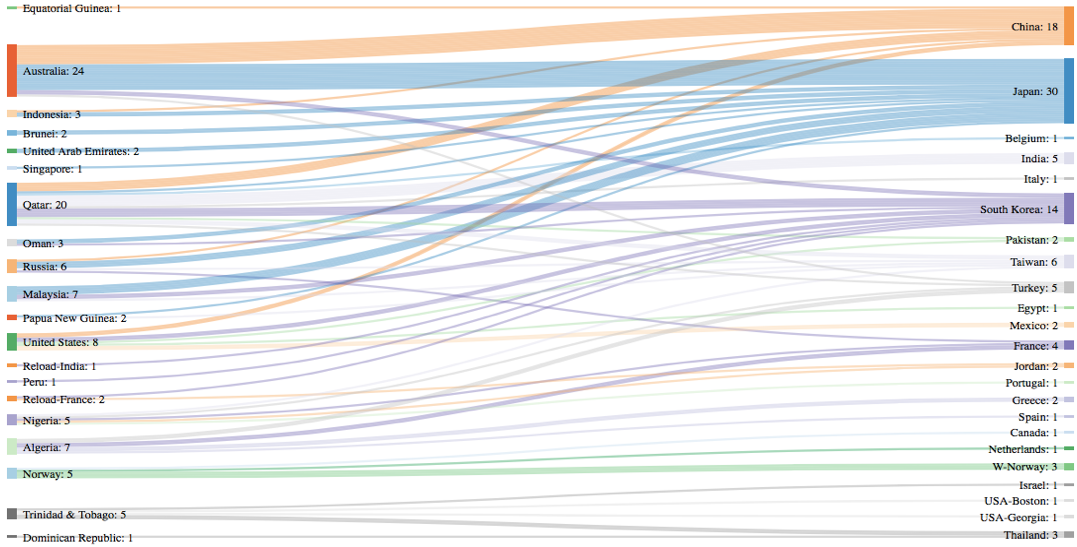
- Japan received 1.83MMT (30 vessels), China 1.29MMT (18 vessels), South Korea 1.02MMT (14 vessels), and Taiwan 0.40MMT (6 vessels) during the week, NEA represents 66.74% of a global trade this week.
- MTD February receipt: Japan at 2.56MMT (41 vessels), South Korea 1.43MMT (20 vessels), China at 1.34MMT (19 vessels) & 0.40MMT (6 vessels).
- DES South Asia is calculated around $9.72/MMBTU level whereas FOB ME estimated at $9.49/MMBTU.
- India imported 0.39MMT (5 vessels), MTD 0.54MMT (7 vessels), while Pakistan received 0.13MMT (2 vessels), one at Engro terminal & one at PGPL terminal during the week, with MTD 0.27MMT (4 vessels).
- North West Europe LNG prices estimated at around $8.30/MMBTU level based upon Asian prices and still have a premium over NBP UK front month price.
- South West Europe LNG also taking direction from NE Asian prices and closed at $8.56/MMBTU level.
- France received 4, Greece 2, while Spain, Italy, Netherlands, & Portugal received one cargo each. Turkey received 5 cargoes during the week.
- Canada received one cargo while USA received two cargoes, while Mexico received two cargoes from the USA.
- Reload cargoes for Asian destination are losing steam as prices are expected to be lower in April and keeping in view the voyage time, arbitrage window will be closing soon, two cargoes received at Jordon & South Korea from France, while one received from India at South Korea.
- This week one cargo left from France for South Korea.
- Asian prices still attractive for European terminals with arbitrage window still open with netback price is coming between $8.20/MMBTU-$8.60/MMBTU.
- US Gulf Coast producer netback price for March delivery for Asian destination comes around $8.40/MMBTU level, still significant margin for US producer, for NW European destinations the netback price comes around $7.43/MMBTU level and for SW Europe its around $7.61/MMBTU, making all three destinations extremely lucrative for the US during the winter season.
- US Henry Hub based price is coming around $5.47/MMBTU on Friday for US based liquefaction companies, which translate into a margin of $2.97/MMBTU for Asian destination, $1.96/MMBTU for NW Europe and $2.14/MMBTU for SW Europe.
- Six cargoes left from Sabine Pass export terminal during the week, destined for South Korea & Mexico.
- Current NEA price around $10.59/MMBTU level is estimated to be 16.2% of Brent 3-0-1 basis.
Author’s Comments
- As mentioned last week, fundamentals have taken over on crude prices and the timing for its impact is start of LNG off season, winter is going to end in a couple of weeks and bearish crude oil prices will also push LNG prices to move south.
- Henry Hub based prices LNG prices will still bring positive netback from US companies for Asian and European destinations, however, European gas hub prices are not making any impact as of today to LNG prices and impact is going to be nil in coming week also.
- LNG prices bullish run during the week is primarily due to demand from North East Asian region on severe cold weather along with concerns on supply issue. Overall market is in a wait and see mode as its almost end of winter season, with some demand still can emerge from Japan, South Korea and China, which will keep pressure on the prices.
LNG Trade Flows (3rd – 9th February 2018)
LNG merchant data is developed in collaboration with Clipper Data LLC, due to Thanks Giving holidays, 24th November data will be shared with next week report)
SUPPLY – TRADE FLOWS
- 96 vessels carrying 6.45 million tons (309.85 BCF) left supply terminal centres between 3rd – 9th February 2018.
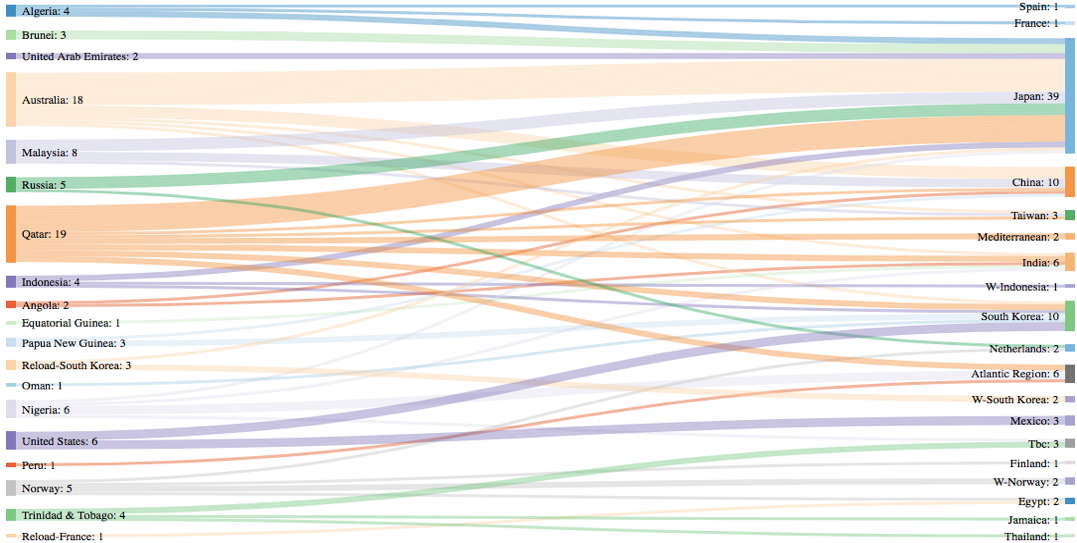
DEMAND – TRADE FLOWS
- 106 vessels carrying 6.77 million tons (325.32 BCF) left supply terminal centres.
Disclaimer: This is a personal analysis based on public information and should not be used for buying and selling of commodities. Source: SGX LNG Index Group, EIA, GIE, and Reuters.