Real effective exchange rates (REER) represent the value of a currency against weighted average value of a basket of trading partner currencies. All currencies in the basket are adjusted for inflation. It is a measure of the purchasing power of the currency, in particular, it calculates the number of units of a domestic good that will pay for 100 units of equivalent foreign good. A primary usage for REER is gauging relative value and trade competitiveness with respect to other currencies and trading partners.
Pakistan’s REER Calculation – A simplified case study
State Bank of Pakistan (SBP) published the following REER values for the Pakistani Rupee for June 2015, June 2016, April 2017, April 2018 & April 2019.
| Measurement Year | REER Value |
| 2015 | 119.86 |
| 2016 | 120.62 |
| 2017 | 127.45 |
| 2018 | 111.09 |
| 2019 | 104.27 |
REER can be used to assess the equilibrium value of a currency. A REER value > 100 in a given year indicates that the value of the currency is overvalued, while a REER value < 100 indicates that it is undervalued in relation to its assumed “fair value of 100” in base year 2010. From 2015 to 2017 REER increased in value which means that exports became more expensive than imports indicating that it there was a loss in trade competitive over these years.
REER is also used to evaluate an individual country’s currency in relation to other major currencies in the index, to see how the country compares to others in terms of trade competitiveness. For example, the International Monetary Fund (IMF) calculates the following REER values (Month 4, i.e. April) for Pakistan and China (Mainland):
| Pakistan | China | |
| 2015 | 114.93 | 130.11 |
| 2016 | 109.32 | 115.43 |
| 2017 | 124.40 | 118.71 |
| 2018 | 107.61 | 124.09 |
| 2019 | 99.45 | 123.47 |
Assuming that IMF uses the same methodology and data to determine Pakistan & China’s REER values, Pakistan fares better than China in terms of trade competitiveness. For 100 units for an equivalent foreign good, Pakistan will only have to pay 99.45 units of domestic good, while China will have to pay 123.47 units.
As can be seen from the REER values for Pakistan from SBP and IMF, the results may vary by entity. To demonstrate the calculation of REER we employ the methodology below. Note: We determine REER for Pakistan in relation to 23 trading partners based on the currencies appearing in SBP’s bank floating exchange rate file.
REER calculation methodology
- Select a base period. The exchange rates, inflation trade weights and the REER result are all values relative to the base period used. Selected based period of April 2015 was used.
- Obtain exchange rates with respect to the currency for which REER is being evaluated, expressed in US $ per currency unit. We are evaluating REER for PKR against a basket of 23 trading partners of Pakistan. Note that UAE and EMU19 are considers as single entities for the purpose of our analysis. We have used SBP’s month end bank floating rates for this purpose.
- Determine an exchange rate index rate for each country in the basket including PKR. This is calculated as the exchange rate for the given period divided by the exchange rate for the base period.
- Determine the relative exchange rate index for PKR in relation to a given currency. This is calculated as the exchange rate index rate for Pakistan divided by the exchange rate index rate for the given country. Let us call this A.
- Obtain CPI for each country in the basket including Pakistan. As the CPI base periods for each country may differ, the CPIs need to be shifted to the selected base period of April 2015. This is determined as the CPI for a given period for a given country divided by CPI for the selected base year for a given country x 100.
- Determine the relative price index for PKR in relation to a given currency. This is calculated as the shifted CPI for Pakistan divided by the shifted CPI for the given country. Let us call this B.
- Obtain the country wise import payments and
export receipts, expressed in USD for Pakistan
for the selected base period to determine the trade weights as follows:
- Weight for a trading partner country = (Import Payments + Export Receipts) for a trading partner country divided by (Total import payments + Total Export Receipts) across all 23 trading partner countries in the basket. Let us call this w.
- For each trade partner country determine: C = (A*B) ^ w
- Sum the values of C across all 23 trading partner countries in the basket, multiply the result with 100 to arrive at a REER value for a given period.
- Repeat the process for each relevant evaluation point in the analysis period. We have determined REER for April 2015 (Base period =100), April 2017, April 2018 & April 2019. The results are plotted below:
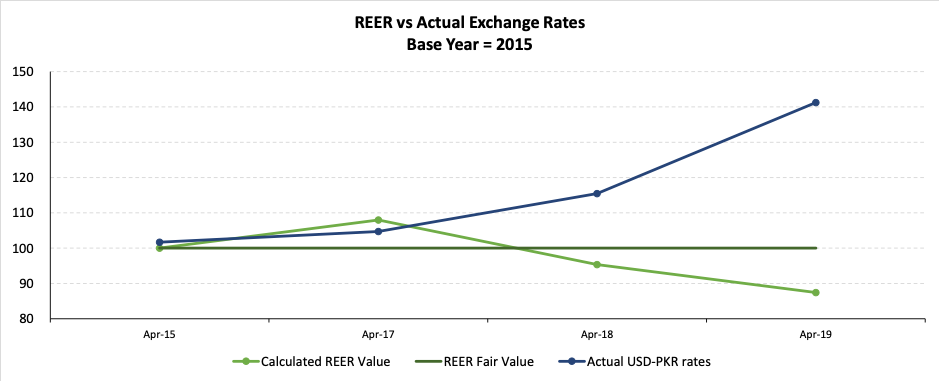
Given an assumed fair value of REER of 100 units in base period April 2015, the REER value in April 2018 and April 2019 appears to be undervalued.
The methodology employed by us including data sources differs from SBP in the following ways:
- SBP calculates REER based on 25 countries for which the IMF has determined trade weights. We have used a different set of countries based on those mentioned in SBP’s bank floating exchange rate published report.
- SBP assumes a base period of 2010 for calculating its exchange rate index. We have used a base period of April 2015.
- SBP uses Special Drawing Rights (SDR) rates with respect to the USD in the calculation of REER. We have used the Bank Floating Rates published by SBP, expressed in US $ per currency unit.
- SBP harmonizes all CPI to base year 2010. We have benchmarked all CPI to April 2015. The reason for this is that we have used the OECD dataset for CPI for a number of the countries in our basket, which uses a base year of 2015.
- SBP uses trade weights compiled by the IMF for base year 2010. We have calculated the trade weights for the countries by calculating the trade volumes (imports + exports) based on SBP data for Import payments and Export receipts by country for April 2015.
To compare our calculated REER values with those determined by SBP & IMF, we benchmarked our results to SBP’s 2015 REER value (i.e. Calculated REER Value for period Z / Calculated REER Value for April 2015 x SBP REER Value for June 2015). The result is as follows:
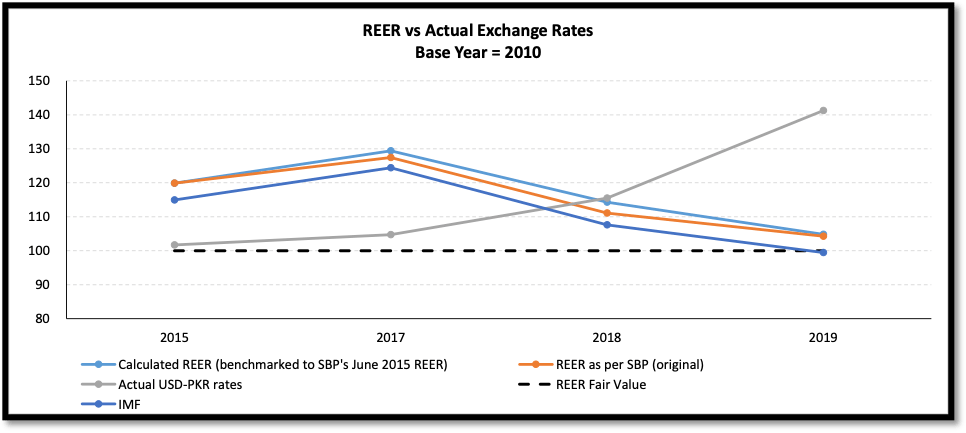
As mentioned earlier SBP REER values are assessed in relation to an assumed fair value of 100 units in the year 2010. While the IMF results show that the Pakistani currency slightly undervalued, SBP and our calculated benchmarked REER values show that they are overvalued in relation to assumed 2010 “fair value”.
Biases in REER
- Values are assessed relative to a given point in the past, an assumed fair value base. In our calculations above we saw that when the base period was April 2015, April 2019 REER value appears to be undervalued. However if the base period is 2010, it is overvalued. An incorrect fair value assumption will result in a biased assessment.
- Trade weights are based on the country wise import and export values rather than the currency in which the trade is settled. If weights based on settlement currency differ significantly from trade weights the REER value will be biased.
References:
- https://blog.quantinsti.com/real-effective-exchange-rate/
- http://datahelp.imf.org/knowledgebase/articles/537472-what-is-real-effective-exchange-rate-reer
- https://www.business-standard.com/article/finance/is-the-reer-model-of-any-use-110042800098_1.html
- https://www.livemint.com/Opinion/6nlCPOcpAw2l0MKUZfv8AN/Is-the-rupee-overvalued-or-undervalued.html