We often speak about process and discipline when it comes to trading. While quality of our research and depth of our trading ideas matters, the two are meaningless without a strong process and the strength to follow it in good times and bad.
A key element in process and discipline debate is limits management at trading desks. As traders and risk managers while we are aware of metrics used by limits platform, a common question vexes all of us. How do you set limits? What are the right thresholds? How do you know the limit system you have set up, works? How frequently should you review limits? In the immortal words of William Goldman in Marathon Man, “How do you know that it is safe?”
Risk limits
Risk limits or trading limits are tools used to ensure that trading positions don’t blow up when markets move against our original view. Limits come in many forms and are structured around factors that are sensitive to changes in risk drivers of a given position, book or portfolio. While the narrative below focuses on risk and trading limits, the same concepts would hold for credit and counterparty exposure limits with some changes.
Limits reflect our understanding of the world and volatility embedded within it. This understanding is based on a combination of historical models and our own risk tolerance. Since these elements shift (models and risk tolerances) on a day to day basis one would expect limits to shift too with the same frequency. In most institutions changing limits beyond approved thresholds is a process filled with friction because the function cuts across department and division lines. Vertically as well as horizontally. Business, Middle Office, Capital Allocation, Credit and Finance all get involved in limit setting exercise and any follow up changes. Trading limits policy and subsequent changes to the policy go all the way up to the risk sub-committees of the board for final approval.
Given the costs associated with running the process, running it every day is not viable for formally regulated businesses. A two-men trading team running 600 million dollars for a family office with a typical trade holding period of a few years may set limits very differently than a FX trading desk at a mid-sized bank treasury. Yet the nature of the beast is such that it must respond to the environment around it.
Risk limit are designed with the above challenges in mind. There is a hard stop, a fixed component to limit setting exercise. As a trading desk we can’t cross it. Then there is a floating moving component where we have the flexibility to reduce or add exposure. The floating moving component can be reset by risk or middle office teams. Changes to hard stops require approvals from a hierarchy going all the way to the board. The two elements work together to ensure that limits systems achieve their objective.
Capital conservation?
Limit management exists to conserve capital. A good limit management system does this by ensuring that allocated capital and exposure to a given position or trade is in alignment with opportunity to generate gains within defined risk tolerance – our ability to bear loss of capital.
How do limits conserve capital? By preventing unexpected market price shocks or volatility to seep through and damage positions and capital base.
To ensure that price changes don’t damage portfolio, gains and capital, limits act as a fuse that protects items of value behind the fuse. They are a gate keeping function and a shock absorption system in one. Limits play the same role as bulk heads in ships and quarantine wards in hospitals. They contain leakage and infection by locking down points of entry into the system.
For trading desks risk can only get in through exposure. By shifting exposure up and down with shifts in risk, we control the amount of risk we carry on our books.
Market price shocks whether expected or unanticipated create challenges for portfolio managers in multiple ways. The most obvious is the mark to market loss (MTM).
We bought a security at a certain price or yield. Markets move against us and the same position in now marked in red. The size of our loss is based on when we realized the magnitude of the move and when we got out. A second order effect is the inability to liquidate large positions at current prices because of downward price pressure. Any additional sales of the security in question would push prices lower, increasing the magnitude of our loss.
A third challenge is correlation that comes into play when markets enter a down cycle. A rising tide may raise all boats but a receding one will do as much damage. Markets hit by a wave of panic sellers create downward price pressure on the entire market. A value driven position within our portfolio may not have anything to do with the current market downturn. It may represent a great deal at current prices. But if no one is buying, there is a reasonable chance we won’t be able to find buyers for our value position, irrespective of how attractive it may see to us. Build enough of this downward pressure (a rush for the exits) and you can trigger a panic run on the instrument or market in question, leading to a significant drop in prices.
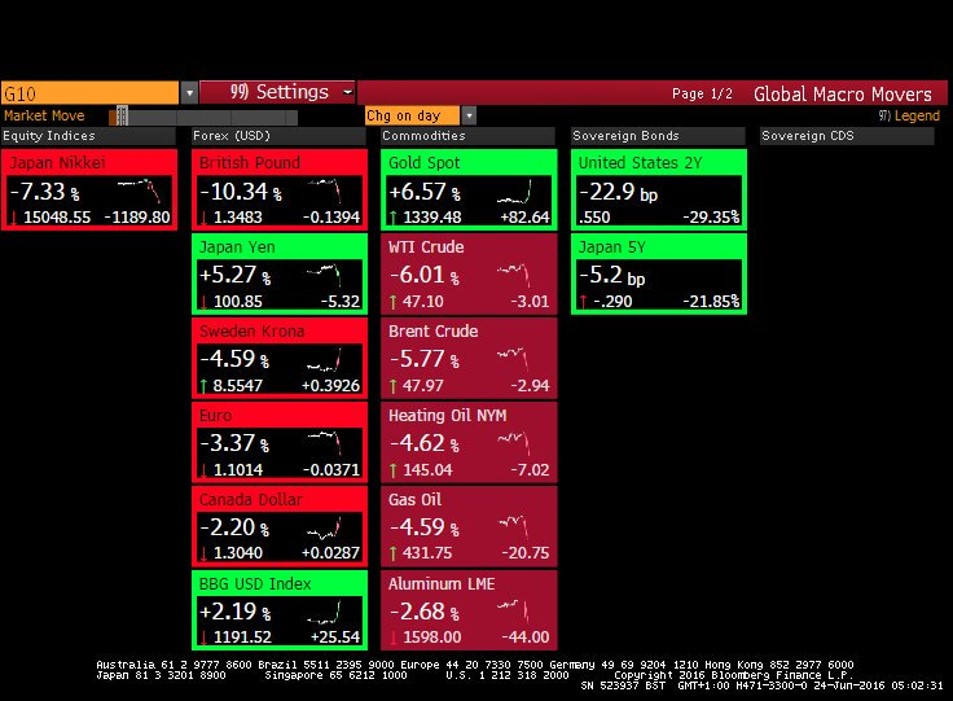
As a portfolio manager, any advance warning before such a shock wave is always appreciated. Given such a warning most trading desk would make a move to safer and less volatile assets (a flight to safety or cash) and reduce exposure (tighten limits) to riskier assets as quickly as possible. No one wants to stand in front of a wave.
Conversely when the shock wave and risk has passed, the same desk may open the spigots to increase exposure (widen limits) to riskier assets. In both instances one would like to take the necessary actions before the broader market has figured it out.
Ask yourself a simple question. Is this how limits work in your organization?
How do you set limits then? In an ideal setting limits, risk and capital should maintain a stable relationship with each other. Limits should increase and widen as risk reduces and/or capital increases. Alternatively, limits should reduce / tighten as risk increases and/or capital reduces. Deviations from this balance would results in an increase in risk borne, loss of capital or both. The underlying assumption is that your metric for measuring risk is relevant and accurate. Without the right metrics or the right measures, you can have world class technology at your back but it won’t do much to protect you.
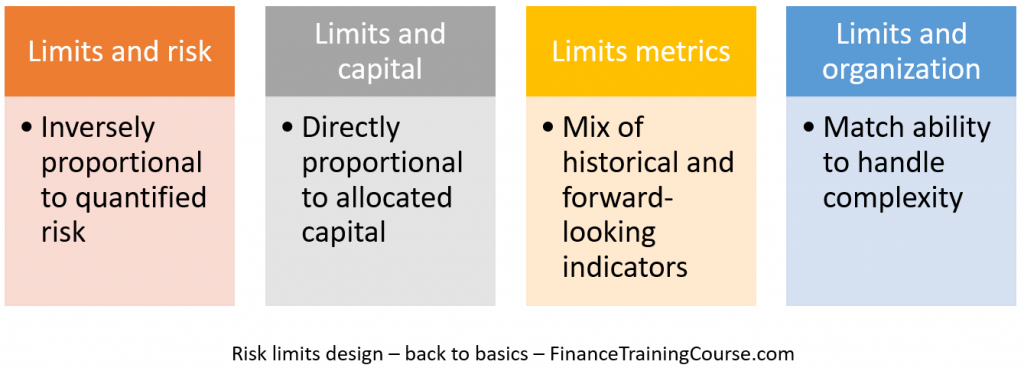
If we agree that risk moves (goes up and down) on a day by day basis then:
- Limits should be inversely proportion to quantified risk.
- Limits should be directly proportional to available capital.
- Limit should use a combination of forward-looking outlook as well as historical behaviors.
Signs of broken risk systems?
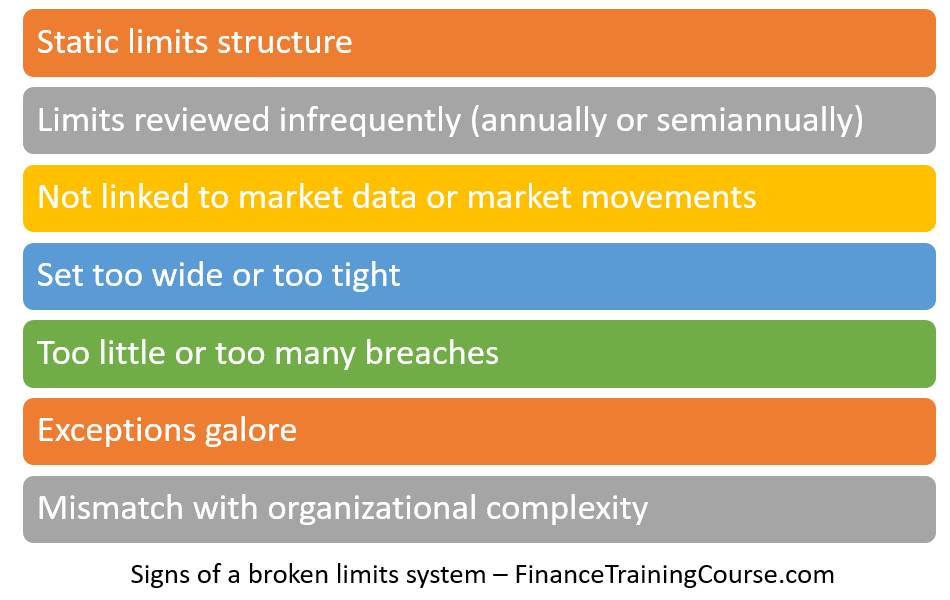
Are your risk limits effective? Look at the following checklist.
If your institution has static limits or limits that get reviewed and revised once a year as part of your annual review, your limit system is broken.
Risk is not static. It doesn’t stay at the same levels throughout the year. Capital allocation should change based on risk tolerances which should be driven by a regular assessment of risk levels in markets. If risk levels change but limit don’t this implies that the limit system is broken and needs to be overhauled.
If you don’t have a quantified measure of risk based on market data, you can’t answer this question. It’s not just about volatility, liquidity, volume, spreads, margins or open interest. It is also about how frequently you monitor and update them. While you can certainly use a mix of leading and lagging indicators, a simpler, well understood system is better than a complex completely confusing approach. A simple responsive system that gauges the pulse of the market on a daily basis is better than a complex system that does the same once a month.
Designed well, a good limit management system should not result in exceptions and breaches on a daily basis. Exception and breaches should occur only when underlying risk level shift beyond acceptable thresholds. That cannot happen every day. If you are breaching limits on a daily basis it is an indication that either the risk measurement system is broken, or the limit system is broken. On the contrary if you are not breaching limits at all, that too is an indication that you have set limits too wide for your protection. The key question here is your ability to measure and track your average daily risk exposure. If you don’t know what that is, technology, systems or talent will not be able to protect you.
Great traders understand this and set limits and risk thresholds accordingly. They treat limits as their first line of defense against capital loss. Not as a hinderance or an obstacle or a regulatory or compliance burden. But this mindset also comes with a cost. When traders view limits as part of their core business, they also want the ability to influence how limits are set. On the other side risk and governance teams see limits solely within their domain. The effective functional space is somewhere in the middle.
If within your organization the focus is on showing who is boss rather than on understanding on why a limit was breached and what can be done to improve your underlying risk metrics, your system is broken.
You cannot roll out a sophisticated limits platform if your organization does not understand what those limits represent. If there is a mismatch between organizational complexity and your limits system, the focus would shift to control, power and influence rather than understanding and controlling risk.
Understanding these boundaries and working with them is part of running an effective risk management team. The ability to hold two contrasting point of views within one system without losing your mind or your functionality. Remembering that there are fine lines between collaboration, collusion and conflict. The first (collaboration) is the desired yet rare end state, the second (collusion) is illegal but quite easy and not that rare despite what your top tier management thinks, the third (conflict) is most common across trading rooms and risk management teams.

So how do you set limits? What are the design parameters behind a good limit setting system? What are the risk drivers for key markets? How does limit setting vary across equities, commodities, bonds and FX? Lets take a look
Traders or risk managers?
A common mistake while setting limits is focusing too much on the past. We need to balance history with a forward-looking outlook.
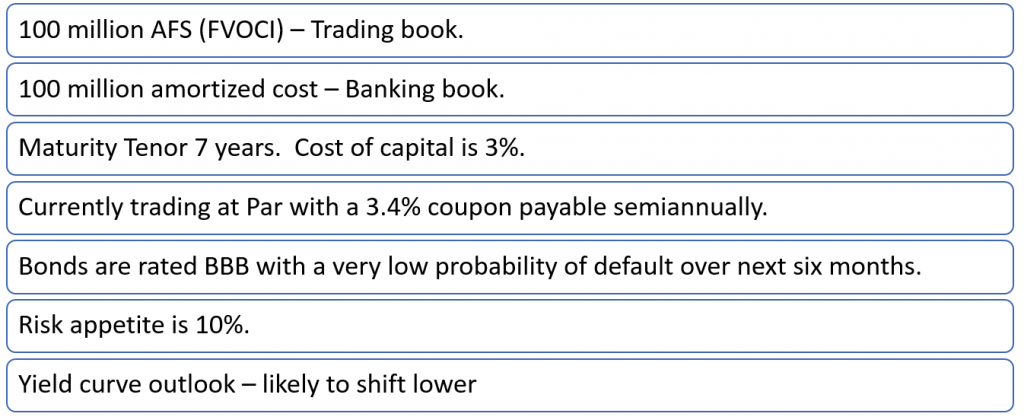
What is a forward-looking outlook? Do we expect markets to rise or do we expect them to drop? Two opposing point of view. Do we expect prices to be frothy and volatility or do we expect them to be stable? Do we expect the yield curve to shift downwards or do we expect it to invert? Expectations and outlook drive the trade as well as our calls for capital. As soon as we start talking about outlook, we move the discussion from historical (rear view mirror) to leading indicators (the windscreen). While it is important to understand the trade and conditions under which it will unwind, it is also important to remember that risk’s role is to make the safety barrier around capital robust. Risk is not in the trading business, it cannot contribute, validate or approve trading ideas. It can only review risk parameters around the trade in order to create a better fuse box.
A better fuse box cannot be designed with just keeping history in mind. Hence limit systems cannot be based just on lagging and historical indicators. We must also include some combination of leading indicators. Leading Indicators serve two purpose. One they work as an early warning system that gives us a heads up before market condition change or the market becomes aware that they are likely to change. Second the right leading indicators may predict arrival of price shock before the shock wave even begins to form on the horizon.
This is inherently alien to the function of risk management. Risk is not about predicting where markets are likely to be. Risk is about survival. Risk is about downside. But risk cannot survive or manage downside if risk has no idea about the shape and form of the wave that is going to wipe the trading desk out.
Since risk is not in the business of trading, it may not necessarily have the pulse of the market, it may not have access to flow of orders, risk will always be at a disadvantage at reading the tea leaves compared to a trading desk. Given the direct conflict in roles and mandates, risk also cannot rely on the outlook and point of view of the trading desk. It must arrive at data points independently. This creates a significant challenge when it comes to flow of the right information. Risk does not want to ask, and the trading desk does not want to share. How do you get these two teams to work together?
Despite the above challenges this is the easier piece. An operating manual for the world when everything goes according to plan. There are issues and compromises, but we can find work arounds as long as we got the outlook right.
What happens when we don’t?
The second piece, the difficult piece is what happens when our outlook is wrong? When the trade turns out to be a mistake? When markets move against our expectations.
What amount of capital are we willing to lose to back our original bet? At what level will we cut the trade, book our losses and come back to fight another day? Cutting a trade and booking losses is not about being right or wrong or being irrational. It is about using historical mistakes and prior experience to define how deep a cut we can bear without losing functionality. What kind of a loss is it possible for us to recover from?
How do you differentiate between allocated capital or capital at risk versus risk tolerance and the ability to bear capital loss? Just because capital is allocated does not mean that you can survive losing it. This is a common misconception in novice traders on trading desks. Allocated risk capital and the appetite to lose capital are two different measure and shouldn’t be confused with each other. The second (appetite to lose capital) is often a significantly smaller subset of the first (allocated risk capital). Allocated capital implies you have been given the go ahead to put it at risk, but not lose it. As a trader and a risk manager it would be beneficial for your long term employment prospects to explicitly clarify what proportion of allocated capital you can actually risk without losing your job, role and/or responsibility.
The big question here is who makes that call? The trading desk or risk? The right answer is neither. If you had built consensus at the limit setting stage, limits make the call to cut a position. But that is not how things work in real life. In real life both functions second guess each other till the hard limit is hit and the position is closed. How can you tell who carries more influence and power within the organization? Check the limit exceptions log. Track the number of times a limit was breached but rather than closing the position, the limit was extended via an exception. Exceptions are a part of doing businesses. But an over abundance of approved exceptions indicates a toothless limit management function and a powerful trading desk.
Fault tolerance in limits is also a function of the trade and context. A leveraged trade in FX or money market is geared to give hi-octane results if you are right. It is geared to explode in your face if you are wrong. Your tolerances in both markets are going to be low. But FX traders tend to have very low tolerances for limit breaches and very strong focus on discipline. Due to leverage these positions are already risky and the margin for errors or second guessing is non-existent. Compared to FX and money market traders you are likely to find more issues within a capital markets (equities) trading desk simply because the underlying discipline is not as common.
A long term value driven trade in an illiquid listed equity is a bet on markets being wrong. You need to be a lot more patient before your payoff is realized. That patience needs to be backed by significant amounts of non-leveraged capital. That is one part of the problem.
The second problem is context and business model. Do you do low volume high margin trades (Equities) or high volume low margin trades (FX). The former allows you more room to be wrong compared to the latter.
Intelligent questions to ask when reviewing or approving risk limits
As a board member what are your responsibilities when reviewing and approving a limit setting system. What are the questions you should and can ask to ensure that the system being put in place will work? How do you evaluate the process?
Here is a list of questions that you can begin with.
- Is there a link between movements in markets and the level at which limits have been set? Do limits change when markets go up or down?
- How are limits thresholds calculated, arrived at or set? What is the basis?
- Is the stop loss limit based on the most likely price shock, the average price shock, the least likely price shock or the completely unexpected absolutely worst case price shock?
- How do you determine bet size? The maximum exposure allowed against a specific position, sector, segment, script or security.
- Who was part of the discussion that leads to the basis for determining risk, exposure, bet size and key risk metrics? How frequently is this basis reviewed?
- How do you evaluate limit effectiveness?
- Are the drivers and basis different for each market? For types of limits? Should they be different?
- Who sets limits? What is his or her background? Does he or she understand the relationship between risk and reward? Was he or she an ex-trader?
- What happens when limits are breached? How are breaches treated? How frequent are exceptions? Do exceptions trigger a review? How do they flow upstream? When and how does the board risk committee see that data?
- How are traders, capital allocators and limit managers compensated? Who pays their salaries and who handles their reviews?
- How do you identify and quantify the impact of near misses, close calls and losses that were avoided because of the effectiveness of your limit management system? On the flip side how do you measure the impact of missed opportunities because you cut capital and positions too soon?
- What is the linkage between exposure, limits, breaches and return on capital? Can you explain it to the board?
- How was the limit system battle tested? What were the results of that evaluation? Were there any changes made to the limits structure after the test run?
Some of these are difficult questions and will trip the most experienced of risk managers. Some are quite basic. Between the thirteen questions above you can get a sense of how effective your risk management team is. The answers are not as important as the thinking behind the answers.