Modeling revenues? Why is this a big deal in the world of founders and financial modeling? Can you put it to work to answer core questions on strategy and focus?
The biggest beneficiaries of revenue and financial models are founders themselves. It is far easier and cheaper to build and test a simple 5-line model in Excel than to roll out a strategy and see it fail in real life. Any investment you make in such a model will pay off if you use the model intelligently.
While the nature of businesses may vary, modeling revenues follows common paths. A simple approach builds a sales model that tracks how products and services are sold. It builds a sales funnel that uses some combination of traffic and conversions to get projected orders. Traffic and conversion are the most common core elements and are tied together with a set of initial assumptions.
Together the two (core elements and assumptions) represent the revenue model and give us our initial projections. Projections and assumptions are tweaked based on reality checks repeatedly till we get to a version which appears to be plausible and close to reality.
Model for founders, not investors. The investors won’t mind and will benefit more from a founder driven model rather than a valuation focused model.
Modeling Revenues – Design objectives
As part of its annual business review, Finance Training Course.com team is trying to put together a revenue plan for the next 12 months. There are three objectives they want to achieve from this revenue modeling exercise.
- Project revenues for the year using a current, as is, state of the world. This will serve as a base case for the next 12 months.
- Identify areas of intervention, where small changes can result in big shifts in revenue for the next 12 months.
- Identify the maximum upside potential possible that can be reached by tweaking the existing site.
Revenues in 2019 have dipped considerably compared to preceding years. The team is worried that they may have been adversely affected by recent changes in the Google page rank algorithm. They want to model revenues in enough detail so that they can understand the impact of each contributing element and focus on drivers that have the biggest impact.
The exercise would be considered a success if they can identify enough interventions to double revenues in the next 12 months.
The business being modeled
Finance Training Course.com is an online education site that teaches the niche subject of computational finance to customers. It sells self-paced learning courses, study guides, excel templates and consulting and modeling services to customers all over the world. The site receives 45,000 visitors and generates 70,000 page views a month on average across the year.
Topic taught by the site include option pricing, risk models, treasury products, asset liability management, portfolio optimization models and advance financial modeling. Customers include bankers, regulators, consultants, students and job seekers who want to prepare for industry job interviews. More than 60% of the site’s traffic originates from North America and Western Europe. Primary source of traffic is organic search.
The most popular products sold by the site are called value packs and include self-study guides and Excel templates. Available value packs include:
- Asset Liability Management Models for Banks. Designed for bankers and consultants.
- Option Pricing using Monte Carlo Simulation. Designed for trading desk quants.
- Interest Rate Simulation Models. Primarily used for fair value and FAS 157 disclosures.
- Portfolio Optimization Models in Excels. For traders and trading desks.
- Volatility Surfaces in Excel. For traders and trading desks.
- Calculating Value at Risk. For risk managers and middle office functions.
- ICAAP and ILAAP guides and model validators. For regulatory reporting teams.
Modeling revenues for online stores
A simple revenue model for online stores can be built by looking at sales funnel for such stores. A customer with an intent to purchase searches for an item they need either on the store (when they are aware of the brand – such as Amazon.com or Booking.com directly) or online (cheapest laptop prices in Dubai, beach side villas in Koh Samui).
Search results direct them to the site or the item landing page. If they are ready to buy and like what they see, they place an order and the item is shipped to them. This sequence can be simplified to:
Intent ==> Search ==> Find ==> Evaluate ==> Purchase ==> Ship and/or Fulfillment.
For the purpose of building our revenue model we break this sequence into the following components:
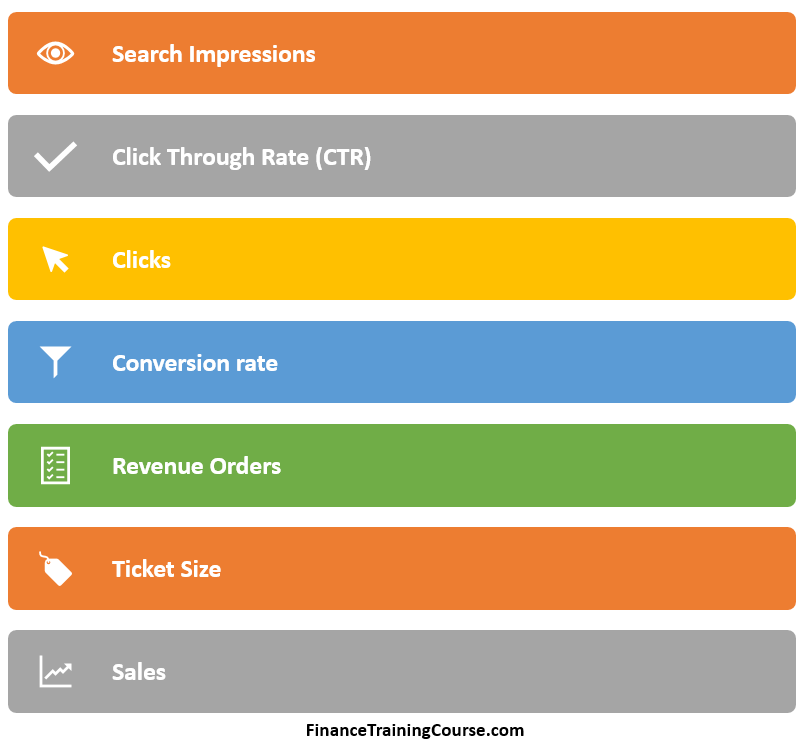
Sales funnel basics
Search Impressions. When someone searches for Calculating Value at Risk and a link or a page from Finance Training Course.com site shows up in the search results, it counts as an impression.
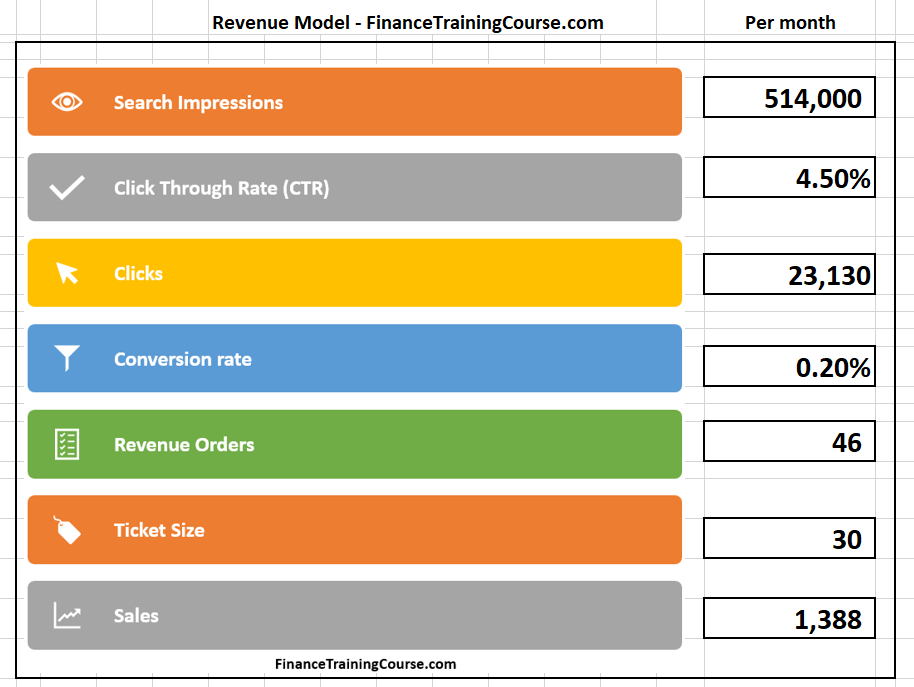
The team uses Google webmaster tools to track impressions by phrases, pages, countries and cities. In the month of October 2019, total impressions generated by the site were 514,000. This means 514,000 site pages showed up in google search results all over the world in October. For the preceding 12 months, the figure was 6.4 million impressions.
These search impressions only over google searches. Searches on other search engines such as Yahoo, Yandex, Bing, DuckDuckgo, Baidu as well as social searches on social platforms are not included in the numbers above.
Clicks and Click Through Rate (CTR). When the same user clicks on the displayed search results and is taken to the site, the event counts as a click. The number of clicks generated in such fashion divided by the total number of impressions generated is the Click Through Rate or CTR for short. The average CTR for the site was 4.5% in October 2019. It was 5.2% in the preceding 12 months.
In October 2019, multiplying the 513,000 impressions by a 4.5% CTR generated 23,130 clicks. For the preceding 12 months the site received 331,000 clicks.
There are pages that clocked higher as well as lower CTR than the site average.
Conversions, conversion rates and Orders. When the just arrived user on the site buys something from the store, it is treated as an e-commerce conversion. The visitor was converted into a buyer. The number of conversions divided by the number of clicks is your conversion rates.
Conversions could be revenue generating or non-revenue generating. This means that events that lead to a purchase may also be tagged as conversions or the site may give up free items to encourage trials and build customer trust. The ecommerce conversion rate for the site in October came in at 0.2%. This meant 46 paid orders were fulfilled and processed by the site. On average just over 11 paid orders per week.
Ticket Size and Sales. Average ticket size of orders is used as the ticket size metric. Total orders times ticket size gives us total sales for a period. Average ticket size was 30 dollars in October 2019. 46 orders times 30 give us US$1,388 in sales for the month of October 2019.
Revenue projections first pass
Depending on how much data we have and how much detail we want we can simply multiple US$ 1,388 by 12 to get annual revenues or repeat the process for each individual month. We can then tabulate the total for the last 12 months to get a figure for annualized sales. Both approaches work well for a high-level estimate. If we go with the simpler approach that multiplies our October 2019 figure by 12, we end up with an estimate of US$16,654 for the next 12 months.
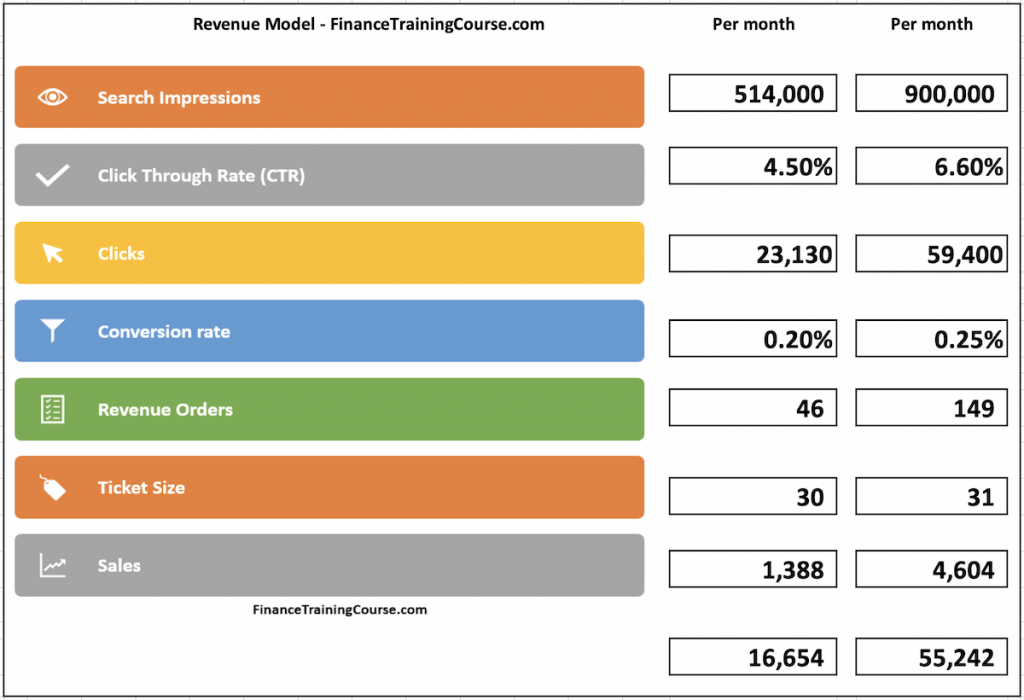
If we plug in the above values in our revenue model, our picture for the month of October 2019 appears to be as follows:
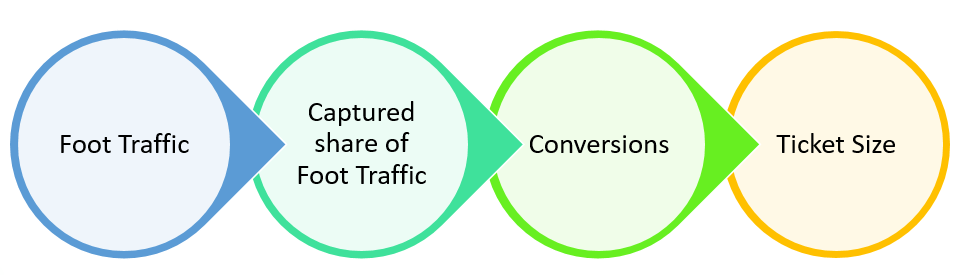
This is the same model you would see at work for a brick and mortar retail store in the physical world. It has just been adapted for usage in the online world.
Impressions get replaced by foot traffic in the mall. CTR and clicks gets modeled by captured share of foot traffic by a shop. The number of people who step into the shop to browse, window shop or price compare. Conversions are sales orders booked by tellers. Number of orders time average ticket size is total sales for the period in question.
Modeling revenues on a monthly basis
Projecting the next six months is a simple extension of the same exercise. We get estimates from November to March for impressions, click through rates, conversions and ticket size. Sources for this data are essentially Google Webmaster (Impressions and Click Through rates) and Google Analytics (Conversions, Orders and Average Ticket Size).
Why bother with monthly forecasts? Why not just work with a simple annualized estimate?
In some industries sales are seasonal. In the case of FinanceTrainingCourse.com we see a big dip in December and July during the holiday season. For consumer electronics and other consumer driven sites we see a big spike during holiday season. If seasonality is material and significant it needs to be modeled effectively.
Sales in the financial training and education industry are seasonal and tend to take a dip from the 2nd week of December to early January as the world takes a break for yearend holidays. There is also a strong link to academic, interview and recruiting cycle in business schools as well as with dates for industry and certification exams. There is a smaller but similar dip in June.
A quick look through the last few years of data on Google webmaster and Google Analytics gives us projected values for impressions, CTR, conversion rates and ticket size. This is the starting set of assumptions that we work with.
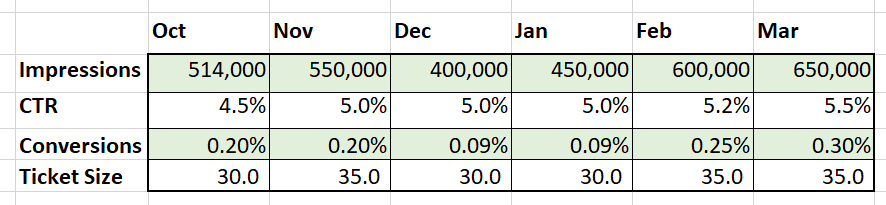
We model the dip as well as planned improvements in traffic and conversion rates as the new site redesign is deployed. Applying the formulas from the revenue modeling exercise above gives us projected gross revenues (total sales) for next six months.
If the site uses affiliate commissions or pays any processing fees to its payment consolidators, that would need to be modelled properly. In our case, the FinanceTrainingCourse.com pays 5.5% of all international sales plus 50 cents per order and a monthly wire transfer fees of $15 every month. When we add these three components, Net revenues drift a little lower.
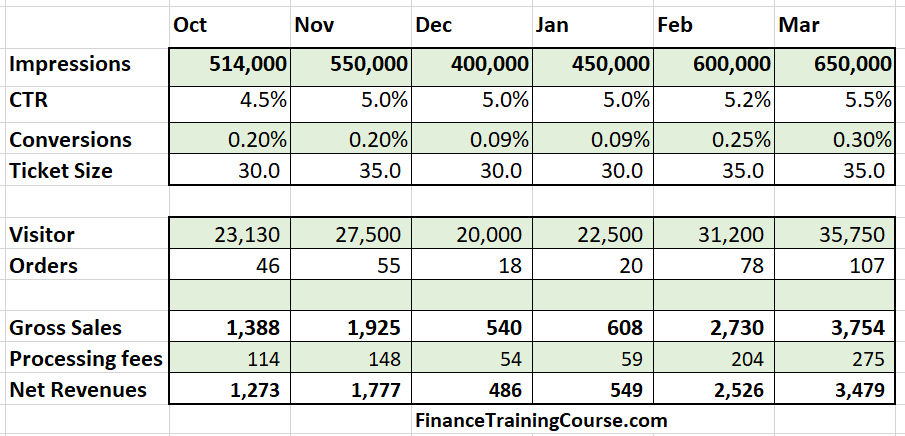
A quick sum across months gives us total and average impressions, visitors, orders and sales for the next six months. Doubling these figures gives us a full year estimate for revenues.
Based on this model the site is likely to generate 6.2 million impressions, 650 orders, US$ 21,888 in gross and US$ 20,180 in net revenues over the next 12 months. This becomes our base case and answers the first question.
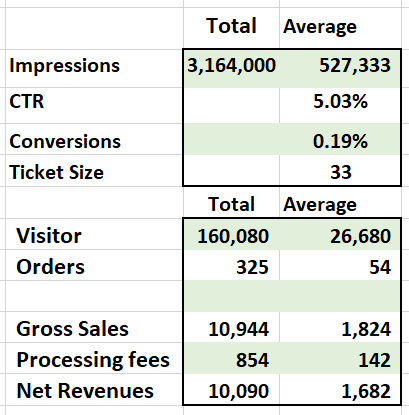
Going back to answer our original question, on an as is basis the site is likely to generate US$ 21,888 (2 x 10,944 – six month projection from the model above) in gross revenues over a 12 months period.
Can you take me higher?
The next question is how can we improve it and how big can this possibly get?
One way to answer this question is to plug in values based on the best cases experienced over the last twelve months. Which means that we identify the highest sustainable impressions (8 million per year), click through rates (7%) and conversion rates (0.45%) experienced in the last twelve months and assume that we can generate these values for the next 12 months. Since these are levels that the site has hit in the past, they do not represent unrealistic expectations but goals that can be reached with some planning, commitment and focused effort.
Generating higher impressions is a function of search engine optimization, site speed and new content. This can be strategy one. A higher click through rate is a function of relevance, titles and meta descriptions. This could be strategy two. Higher conversions are a function of landing page design, effective calls to action and site speed. This could be strategy three.
The three strategies answer question number two. What can be done?
A few questions that should be answered before we pick one or more of the above strategies.
- If we can roll out the red carpet for the full range of these interventions, how would our revenue calculation change?
- Of the above parameters which ones are the most important and relevant?
- Where could we see the biggest impact of any improvements?
We start two of the most obvious – click through rates and conversion rates. Higher and better click through rates would feed more traffic to the site. A higher conversion rate would feed more orders. Between the two we would see a significant jump in revenues.
Here is what a simple analysis suggests. If we could push impressions to 900,000 per month, CTR 6o 6.6% and conversion rates to 0.25%, we can scale revenues from the current US$ 16,654 figure to US$ 55,242. A more than three-fold jump.
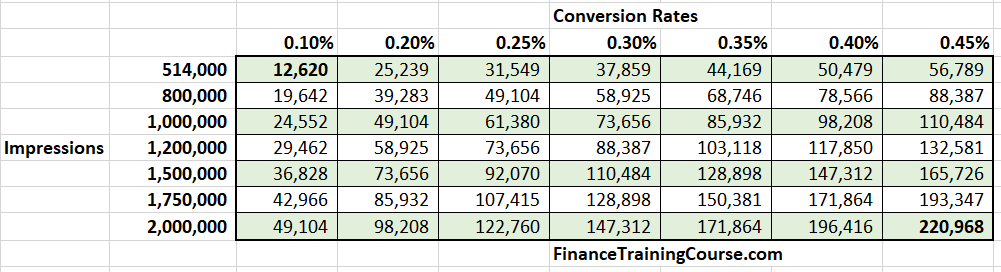
What if we can’t move impressions, but we could improve CTR and conversion rates? A simple data table comparing the impact of conversion rates and click through rates on our original base of 514,000 search impressions per month, answers the question for us. Everything else other than CTR and conversion rates is held constant at the original value including impressions and ticket size.
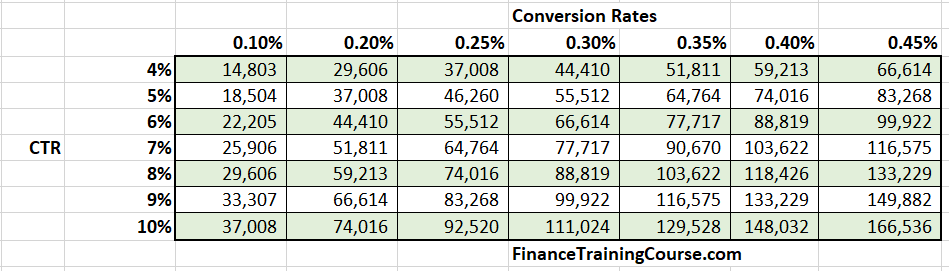
In the table above as you move horizontally, you move across conversion rates. You move vertically to move across click through rates.
For example, the lower most cell on extreme right with the value of US$ 166,536 corresponds to a click through rate of 10% and a conversion rate of 0.45%. It indicates that done right the site has the potential to generation as much as US$ 166,536 in annual revenues. Almost ten times as much as what is being generated today. This answers question number three. What is the maximum upside?
But what about impression, if you could grow impressions 4 fold using a combination of new regular content, faster servers and better servers, would you be able to grow the numbers 4 folds?
Here is a different data table that replaces CTR with search impressions and plots impressions against conversion rates. The two tables that follow use a single CTR for the analysis. The first one uses 6.6%, the second one uses 10%.
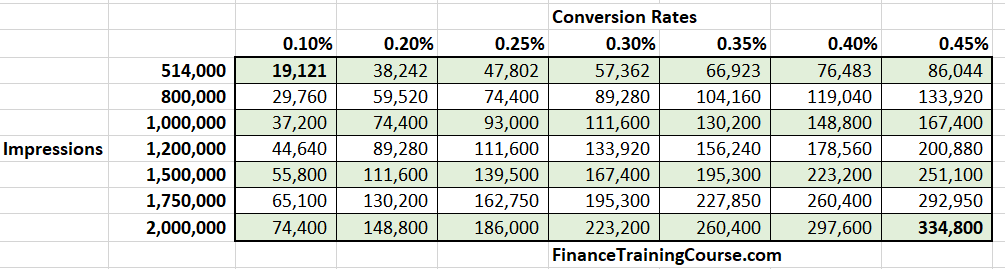
Increasing search impressions certainly helps but a four fold increase in impressions only doubles revenues at the most optimistic CTR and conversion rates. The same four fold increase in conversion rates or CTR increases revenues 4 folds.
Converting these figures to annual projections suggests, that with some changes and focused intervention in improving conversions and click through rates, annual revenue for the site could jump from current projections of US$21,888 to US$ 333,000 a year. Adding additional content and improving traffic generation potential could take the figures even higher to US$ 669,600 per year.
All this is before we consider possibility of raising prices, or adding higher value items to our product mix to push average ticket size higher. US$ 669,600 sounds cheap? Like to crack the coveted million dollar per year club? Do all the above and push average ticket size to $46.3 per order and its yours to take.
From a strategy point of view it makes more sense to focus on improving conversions and click through rates for this site over increasing search impressions. Common sense, I know, but backed by numbers that we can take to our internal strategy meeting.
Modeling revenues and strategy
Now that we have a baseline model as well as a range of values, we can use it to answer quick questions that the team has been asking itself.
What about advertising? Can advertising help us increase revenues on the site.
FinanceTrainingCourse.com is a niche site that focuses on the more exotic areas of computational finance. While it ranks highly on some competitive key word the volume of traffic it generates is not enough to be attractive for advertising.
From organic search the site has the potential to generates 30,000 (current) to 60,000 (best case) visitors per month. These visitors generate between 45,000 to 90,000 page views per month. If the CPM (cost per milli or cost per 1000 impressions) for a key word is one dollar, the site will generate 90 dollars per month in advertising revenues under the best case. If we rank on higher paying key words, the number will at max jump to 360 (4 dollars CPM) to 400 dollars (5 dollars CPM) per month with these traffic levels. Since more than sixty percent of the site traffic originates from North America and Western Europe an the focus is on finance this is both doable and believable. Attractive if there are no other sources of revenues and you are desperate. To get to a thousand dollars a month FinanceTrainingCourse.com would need to double its current traffic levels, which is a tall ask when your focus is on teaching people how to build exotic quantitative financial models.
There is another challenge. Advertising supported sites typically suffer from lower e-commerce conversion rates and whatever revenue gain we pick will be at the cost of lower sales. Since margins on selling models and content are significantly higher than advertising, an ad supported model for the site would be like shooting yourself in the foot. You would lose conversions and credibility at the same time.
Given the drivers we have seen above, lower conversion rates lead to significantly lower orders and lower sales figure for the site.
To generate US$12,500 in monthly advertising revenues which corresponds to US$150,000 a year in revenues from a 1 dollar CPM we would need to generate 12.5 million page views a month. Which doesn’t seem likely for a niche site focuses on quantitative finance. Fashion, life style, teenage relationship advise, yes. Rocket science in Karachi, no.
If I write one new long form article per week that costs US$ 100 to source per article, what is my likely uptick in revenues?
Would I be better served by just spending that money on better and faster servers so that I can jack up site speed?
Historical traffic analytics from the site suggests that if we can maintain a steady stream of well written and well-timed long form articles the approach will increase visitors to the site by 10% to 20% per month over a period of 3 months. Let’s call this option one.
Using our base case of 23,130 visitors. A 10% increase will add 2,313 visitors in the first month. At 20% the jump will add 4,626 visitors. With 0.2% conversion rate it will add 4.6 to 9.2 orders. At 30 dollars an order, it will add $139 to $278 in revenues in the first month. 278 to 416 dollars in the second and third month, if we can maintain the growth rate for months that follow.
Using the articles to generate traffic strategy will only breakeven at the end of month three but would need to be fed for the first two months. At the end of three months we have spent 1,200 dollars on 12 articles and have booked incremental revenue of $833, losing $367 dollars for three-month period.
Compare this to an alternate strategy, labeled option 2. Spend US$100 a month and upgrade to faster AWS servers. With some basic speed optimization improve average site and page speed by 20% and improve conversion rates from current 0.2% to 0.25%.
Assuming no change in traffic levels, the increase conversion will add 12 odd orders per month and 360 dollars in revenue for a spend of $100. This strategy is more profitable then the content led one and nets 260 dollars a month, every month as long as the faster servers can support faster page speed. If the increase page speed also leads to higher traffic, all incremental traffic related conversion orders would be an additional bonus.
A third option is to push for better click through rates by reviewing metadata and content. Let’s call this one option 3. Assuming an effective meta data and content review costing $100 dollars a month allows us to push CTR from 4.5% to 5.5%. You can do the math as an assignment in the background.
Here are the results, once you are ready with your figures. The jump leads to an incremental 10 orders a month and generates $300 dollars a month in new revenue.
So it makes sense to focus on improving your CTR, site speed and your conversion rates when you sell product on your online store, rather than deviate to advertising or push content spend. CTR, site speed and conversions also help when you are advertisement supported but the numerical impact is significantly higher when you are running a store.
Without an effective revenue model, you can’t evaluate the relative merits of option 1, 2 or 3. Armed with one you can clearly pick one that suits you best.
Model for founders, not investors. Remember its cheaper to build and test in Excel than in the real world. Your investor won’t mind. The smarter ones will thank you.
An extract from chapter one from the much delayed Financial Modeling for Founders.