The Survey data set
2018 was the first year we ran State of the Technology Industry Survey. The objective was to have a data driven profile of technology industry in Pakistan that would help size up footprint of technology sector in the country.
Good data drives decisions and effective policy. Without it we are lost. Given its potential for creating employment, generating export proceeds, help with import substitution and improve quality of life for general population, the ICT industry is often under the inspection lens. Two oft repeated common questions deal with our size in numbers (how many companies are there?), revenues (how much do we make?) and our employment potential (jobs created this year and next?). The number of individuals we employ and plan on hiring in coming years is an important input to the education industry. Should undergraduate programs in computer science expand current capacity or add other majors?
While several efforts were executed in the past, the last formal industry study sanctioned by PASHA was run in 2007-2008. Ball park and semi-official figures are quoted at public forums but absence of hard data leads to credibility issues and challenges that haunt industry historians for years.
In 2018, 94+ survey entries were received. Entries were filtered to 91 after a filtering criterion was applied to remove institutions that were not directly related to software and IT enabled services. Data entry phase for the survey ran for four weeks in October and November. Data tabulation occurred in the last week of November with survey results and a summarized report going out to participants in early December.
In 2019 we received 98 responses to our survey form. Giving us a combined 2018-19 pool of 192 entries from two years of data collection. Two entries came through informal channels (via company founders) after survey submission deadlines had expired. Twenty entries were common across two years of data collection.
The collected pool of entries was used to calculate revenue per employees per year, by city, by product vs services, by domestic clients versus international client for all players. These benchmarks were then applied to publicly available employment data for 25 companies with over 100 employees that had not participated in the survey but are considered key players in the local market. The indirectly estimated results of the 25 companies were added to the combined data set to create a blended data set. The blending mix was 85% directly collected, 15% indirectly collected entries. For businesses that didn’t share revenue estimates, a similar approach was applied to estimate annual revenues. Numbers for a few selected entries were cross checked and verified via industry sources to validate underlying assumptions.
The final blended data set for 2019 Technology Industry Survey stood at 220 companies. Together these businesses generated US$ 1.35 billion in revenues employed 70,000 individuals across a two-year period. A brief summary profile of the data set is presented below.
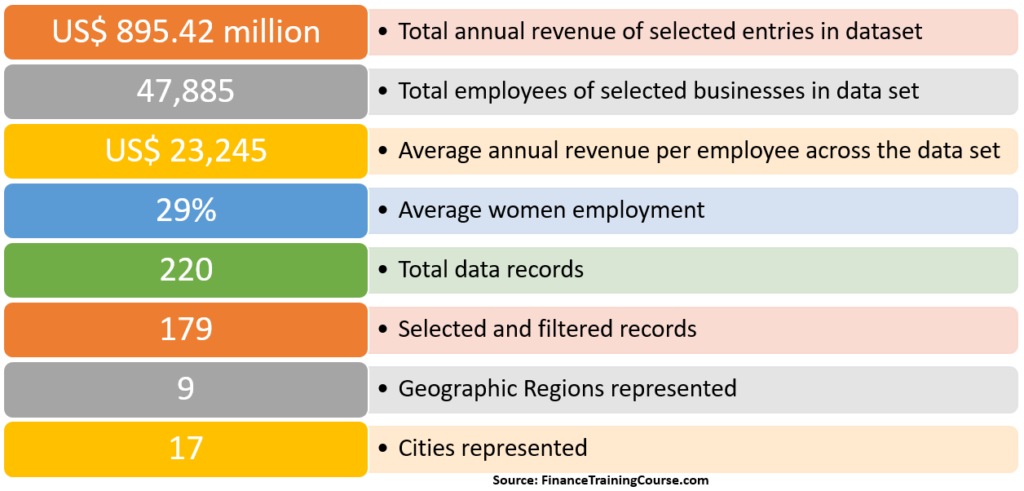
A final filtered set of 179 companies was used to generate results shared in the State of the Technology Industry Survey for 2019. This filtered set booked annualized revenues of US$ 895 million per year and employed 47,885 individuals.
This year we also specifically tagged startups, product focused pure plays and e-commerce players so that we could run additional analysis on their data and benchmark their profiles with the industry.
When we run the survey again in 2020, we expect the pool to jump to 300 participants, making this the largest pool of data collected on the technology industry in Pakistan in recent years. This is one of the reasons why it is important to run this exercise every year. In addition to getting fresh data from new companies, we also get a sense of survival and transition rates of businesses in the tech sector.
While a 200+ dataset is not representative of the entire technology industry in Pakistan, it is more credible than non-data driven, off the cuff, industry projections and sizing figures that can be found in the ecosystem.
Key insights
More younger companies. Younger companies formed the largest group in the data set. 48 companies with ages less than 2 years, 37 less than 4 years and another 37 less than 7 years. A second cluster of companies exists at the 13 – 17 year benchmark. Together, these 193 companies represent 87% of our and three distinct generations of founders and businesses.
The youngest businesses were all started after 2016. The relatively younger post 2014-15. The second middle age cluster companies opened their doors after 9/11, 18 years ago. The oldest company in the data set setup shop in 1952.
More product companies. A younger company is also more likely to be a pure product play rather than a services play. The largest number of product companies in the data set are less than 5 years old. More mature players are set in their ways and find it difficult to switch to products later on in the game. There is also a significant opportunity cost for older players to walk away from existing services contracts to focus on product bets. Product companies required talent profile and organizational mindset is also significantly different from services companies.
Product employee and revenue productivity. Product companies serving international customers continued to earn significant premiums in revenues per employee per year compared to companies serving domestic customers or pure services plays. The industry average for revenues per employee per year stood at US$23,245 per year. Pure product plays serving international customers on average earned US$41,784 per employee per year. Players with a dual focus on product and services and local and international customers earned US$28,457 per employee per year while services only teams focused on domestic markets billed US$19,570 per employee per year. Assuming we use a similar cost basis for technology resources, products companies tend to be at least twice as profitable as pure services play. There are a few exceptions that are significantly higher than this benchmark.
From a billing and revenue productivity point of view pure product teams focused on international markets remained the preferred business model. It is not an easy model to execute, requires some exposure to underlying domain, a supportive client group and a longer runway. However once a team gets it right, it is significantly easier to defend, retain talent and grow compared to pure services plays.
Growth projection weighted by revenues for 2020 stand at 23.1%. Up from 19% projected from last year.
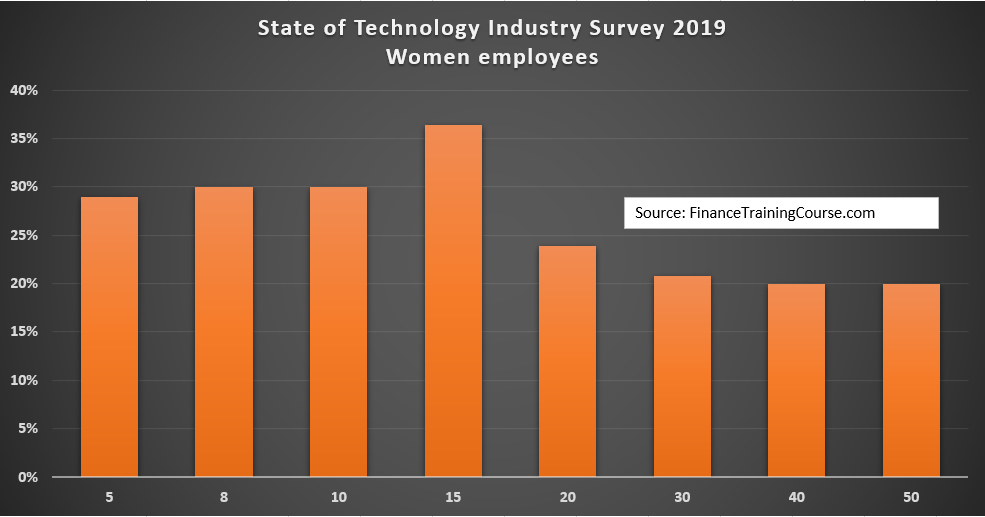
Women employment and participation in the technology sector work force went up by a notch and moved to 29%. Up from 26% in 2018. A higher number from the larger data set indicates that the actual percentage for the complete industry population is likely to be higher.
Women are more likely to work in younger firms rather than older firms. Which may indicate a bi-directional generational preference on both sides – employers as well as employees. This is backed by data when cut across women employment rates and employer years in business. Companies up to 15 year of age are more likely to employ women employees compared to older businesses
2019 was a hard year for many businesses. Technology industry was not an exception to this trend. Less than 70% of businesses who answered a question on growth in 2019, hit their growth objectives. Among the businesses that shared data in 2018 and 2019, revenues at quite a few businesses remained static or dipped. Having said that, more than 90% expect 2020 to be a great year financially. There were some businesses that still did really well in 2019 despite regional and local economic challenges.
Industry employment and size. 179 companies, billing $895 million annually, employing 48,000 individuals. The software exports industry size is estimated at two and a half times this amount. In terms of the current data set and its benchmark that would size the industry at 450-500 active players with $2.25 in annual revenues within the formal sector. Based on these benchmarks total technology industry employment is likely to be somewhere between 96,000 to 120,000 employees across Pakistan, excluding the free lancer community. Given projected industry growth rate of over 20% this number is likely to double in five years. In 2007 at the time of the last formal industry study, this figure stood at 12,000 employees. We have certainly come a long way since those early days.
What is holding us back?
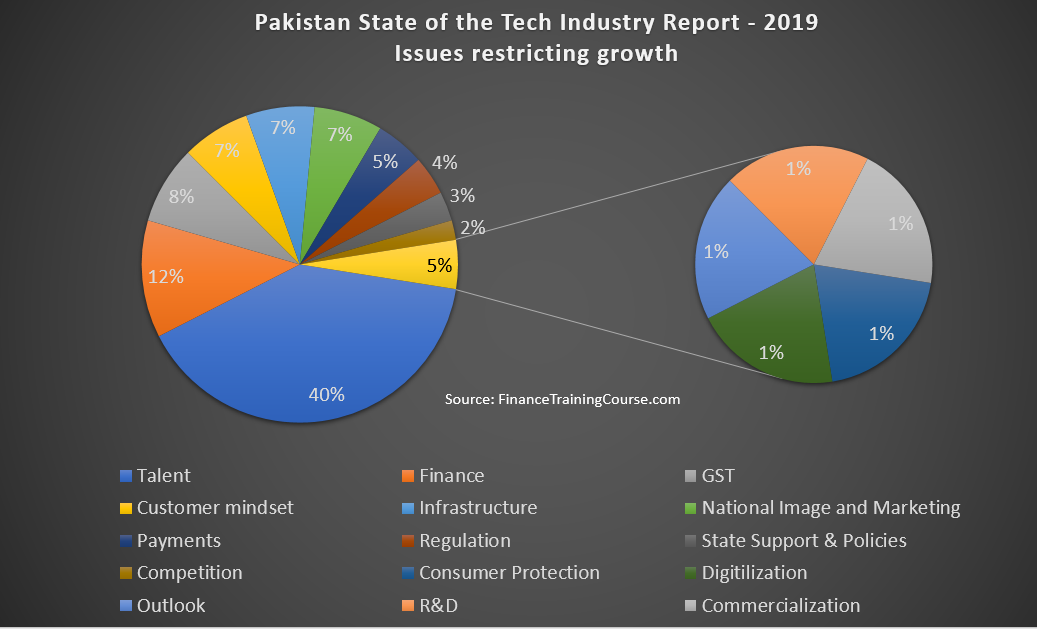
The biggest growth challenge for the industry was once again identified as talent. Of 100 companies that answered this question, 40 identified talent related issues as the primary challenge to meeting growth targets.
Availability of experiences and trained resources, fresh talent that can hit the ground running, and qualified senior and middle managers remained an issue. Retention, training and growth for existing teams was the second big issue under the talent management head. The 23% growth figure remains at risk if we can’t fix the resource and talent supply equation.
The issue with talent
As debated earlier on this space the talent problem exists at three levels.
First, there is a limited pool of naturally gifted developers and computer scientists who are wired to do well in this field. Not all of them make enter the field at the right ages. Some of these individuals opt for other professions at younger ages because the industry does a terrible job of marketing to the younger generation.
There are not enough public role models visiting schools, campuses and outreach event to speak about the range of choices available in the CS profession. The primary perception of roles within the sector are those of boring, desk bound, back office, human interaction less positions. Beyond perception, computer science education at middle school programs as well as at the high school level is more focused on basic computer literacy rather than structured problem solving and exploration.
If you want to help solve this problem, go visit a school in your neighborhood, speak to students of grades 6th and 7th and inspire them with your work and personality.
The second challenge is the absence of effective co-op programs that showcase relevant skill sets and on job training for students while they are still enrolled as students. There will always be a disconnect between academia and industry. Co-op and internship programs are used all over the world to effectively bridge this gap while students are still enrolled in their program of study. While such programs do exist at selected companies, the number needs to increase significantly.
If you want to help open your organization to accepting summer interns across all age groups, including young school students.
The third is the curriculum mismatch. As an industry we don’t just need developers, given the increasing shift to higher quality work and products we need designers, architects, subject matter experts, testers, account managers and more. While the choice of universities and programs has increased significantly, there is still more work that needs to be done on this front.
Volunteer as an adjunct lecturer, professor or teacher at your neighborhood school or university. Build more diverse teams within your organization.
The fourth is improving employee productivity and utilization of under-represented groups such as women. Organizations need to invest significantly more in employee training, in running internal training programs, better workplace environment, in sponsoring “finishing schools” for students from third and fourth tier universities, and in hiring more women. Together these initiatives can act as temporary bridges while we get our act together on the education front.
What is the profile for a typical technology company in Pakistan?
The larger data set this year shifted the benchmark profile of a tech company again. Because the data set is still evolving, we are likely to remain in discovery stage for a few more years.
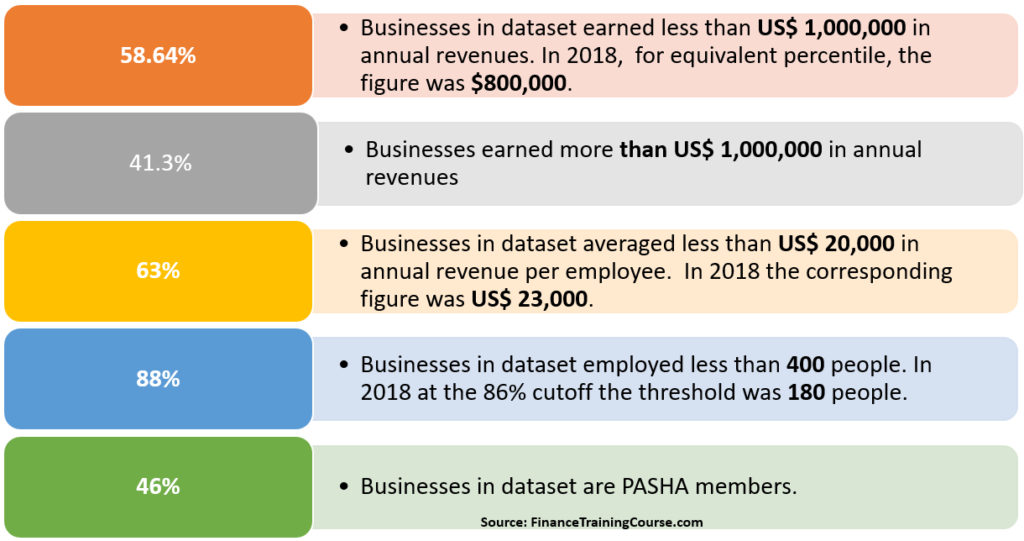
If we use 55 – 60 percentiles cut off as a benchmark, a typical technology company in Pakistan from the collected data set is:
“Setup post 2012, earns US$ 500,0000 to $1,000,000 a year in revenue, employs less than 50 people, 30% women employees, bills $15,000 to $20,000 per employee per year in revenue, offers services with a potential product in development, wants to be a product company and is likely to be based in Karachi or Lahore. May or may not be a member of the industry association.”
What does this mean? Statistically speaking if you want to represent or paint a profile for the technology sector in Pakistan you are more likely to meet companies with the above profile than others. Today they represent the largest share of our data set.
The 55 – 60 percentile cutoff means that the profile describes above is applicable to roughly 3/5th of the companies in the data set. When we set policies to impact the largest group of businesses, this is the profile we need to keep in mind.
While bigger more mature players continue to retain their place and stature, the sheer number of newer teams and businesses being formed in the technology space is redefining the profile of the industry. With the changing profile the industry ask from its leaders is also likely to change.
While there are 58 players today in the data set that earned more than US$6 million a year in revenues, up from 10 from less than a decade ago the rate of growth of younger, product focused teams is significantly higher. In less than 5 years, this number will be cross into triple digits with most new additions coming from the pool defined above. When that happens, given the trend we have been seeing, the new threshold for these rising businesses is likely to be US$10 million than $6 million.
More importantly while older, more mature players are all members of the industry association, the younger generation is not. If the elders of the industry want to remain relevant, they would need to work significantly harder to build a trust based relationship with this new group of players. Beginning with ensuring that their interests are well represented in policy setting forums.
Biases
The data set suffers from a few well known biases and issues introduced by how we collect the data.
First information is taken at face value at the collection stage. If numbers are misrepresented or misquoted, there is no way to identify such misrepresentations at the collection stage. At the tabulation stage we can identify entries that should be investigated and revised by applying industry benchmarks mentioned above on all submissions. This is done selectively on outliers and quoted numbers for such companies are checked and verified discretely via industry sources or company founders.
Second, given sensitivities associated with sharing financial information, revenue data is collected in form of ranges. Participants are also given the option to not share their numbers at all. A similar range-based approach is used with employee count, growth projection, number of women employees and other metrics. As long as we have credible employee data, estimating revenues by applying regional, city and sector specific benchmarks is possible.
At the tabulation stage all answers shared in the form of ranges are converted to midpoints. For instance, reported revenues between US$ 500,000 and US$1,000,0000 per year would be translated to US$ 750,000 per year. While this does create a bias, this appears to be one of the easier ways to collect financial information across a broad spectrum of companies in this sector. Errors have most likely been introduced due to the methodology above but given the size of the data set they should average out.
The Industry Survey Dataset – A second look
Of the 220 companies, 105 companies, the largest group reporting data, are from Sind. Punjab and Islamabad formed the second largest group with 43 and 25 companies respectively. While the actual state of technology development and company formation on the ground may be different, a willingness to share data is a sign of sector and segment maturity. While numerous efforts were made through social posts, email campaigns to participants of previous survey as well as outreach conducted by influencers in four key cities, data collection in Punjab and Islamabad continues to remain a challenge. Of the three, personal outreach by influencers and mentors remained the most effective data collection approach.
A big word of thanks to contributing members in both years from Punjab and Islamabad who bucked the trend and shared their information. While PASHA membership rolls indicate that the largest number of registered technology companies are based in Karachi, there are still significant members in the two regions above who did not participate in both years.
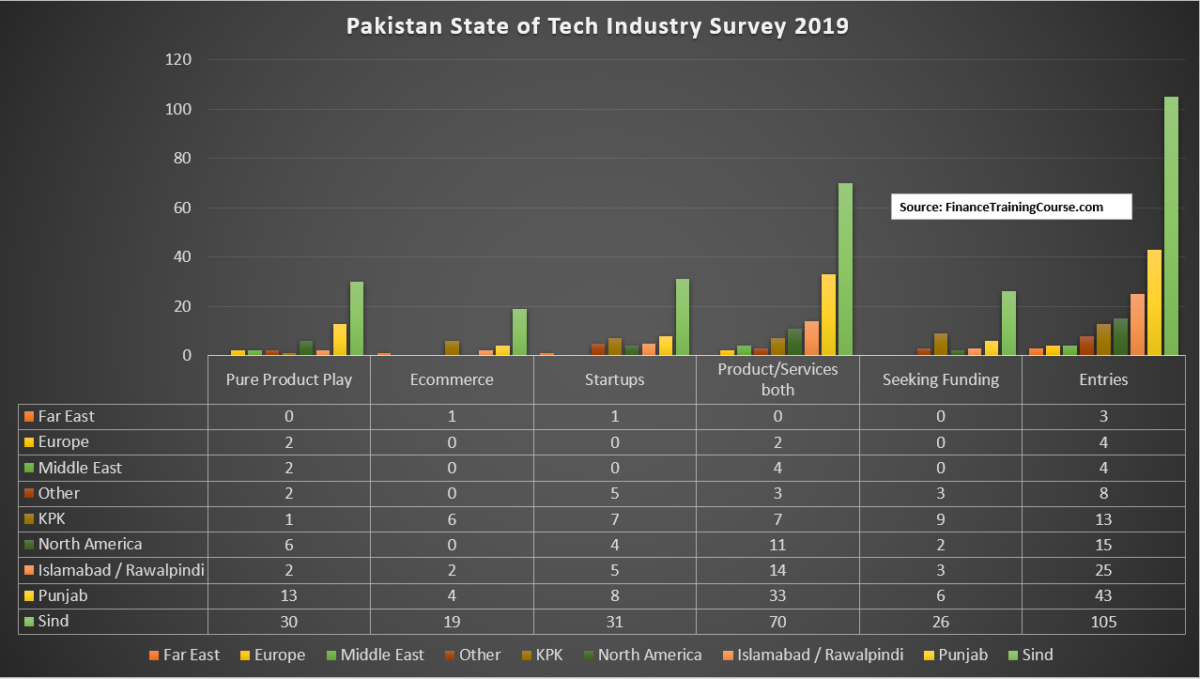
Here is a breakdown of the 220 who did contribute data.
58 are pure product plays, 32 are focused on ecommerce, 61 are startups, 49 are planning on raising funding in the next 12 months and 144 of the 220 are running a mixed product / services setup. Which means that while they are primarily services shop, they have products in the works or being deployed in the field. Only 74 are pure services firms.
It is heartening to note that there is a clear shift towards products across ten years. About a decade ago this distribution was 2/3 services, 1/3 products. In 2019 it is one third services, 2/3 mixed and 1/3 pure products. The number of startups in the dataset compared to last year is one of the reasons behind the slight depression in average revenues per employee per year in 2019 compared to 2018 results.
This is a developing story that will be updated over the next few days as survey results are released to participants and contributors to the data set. If you have contributed data to the data set in 2018 or 2019, you will receive a complimentary copy of the summarized results by the evening of 6th December 2019.
The summarized report will be available on request to students, academia and policy makers beginning January 2020.
A big thank you to the many friends, colleagues, students, influencers and peers who opened up their data set for the preparation of this analysis.
Special thanks to Jehan Ara, Khurram Zafar, Asif Peer, Faizan Siddiqi, Faisal Khan, Zohaib Khan, Ali Syed, Peshawar 2.0, KPK IT Board and many others for their help and support through out this process.
Founder Puzzles.
The Pakistan Technology Industry Survey 2018 and 2019 were sponsored by Founder Puzzles.
Founder Puzzles, Build better businesses right from the start, a new book on financial modeling for founders and startups by Jawwad Farid. Scheduled release date 31-Jul-2020.
Learn more about the book at https://bit.ly/FounderPuzzlesBook. Preorders open now at https://bit.ly/FounderPuzzles