Earlier this year, Blue EX became Pakistan’s first logistics firm to list its share on the PSX GEM Board.
3PLs or third-party logistics are companies hired to outsource some form of logistics or fulfillment services for merchants including inventory management, warehousing, packaging, and delivery. 3PL has always had a symbiotic relationship with eCommerce.
While there is an ongoing debate about the future of shipping paper (the traditional courier business), supply chain logistics is an operationally complex business. What makes it promising is the outlook of the ecommerce business, the trajectory of this space in other comparable markets and the milestones it is likely to hit.
We were engaged by Blue Ex to produce a valuation matrix, a range of valuations based on a number of underlying scenarios and parameters. You can take a look at the full report, read the summary below or view the 18 minute case study video that walks through the approach and thinking behind the model.
Please note that this is not investment advise. Please consult a qualified financial advisor before making any investment decisions.
Here is the game plan for the post.
To truly understand the value of Blue Ex, we need to first step back and take a look at Pakistan’s eCommerce segment. We start with that. We take a look at available data points that can help us size the market, set growth assumptions as well as demand drivers. Then, we follow through by taking a look at comparable multiples from India and Indonesia and wrap it up with presenting the valuation matrix.
Our valuation approach for Blue Ex
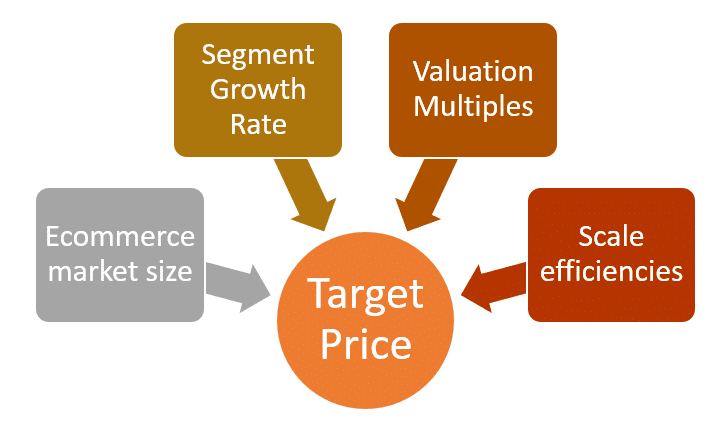
a. Value drivers
Ecommerce segment. Where is the logistics correlated segment of E-commerce market in Pakistan heading? North or south?
Segment Growth rates. At what rate is that segment growing? What will drive that growth?
Valuation Multiples. Where are multiple for logistics segment heading? Comparatives? India? Indonesia? US?
Scale. What can scale efficiencies and productivity gains do for this business?
A key takeaway here is for the 3PL business, not all ecommerce segments are equal. Fashion, cosmetics, personal care, consumer electronics are far more important than mobility and hyper local deliveries.
i. Ecommerce segment
The starting point is the projected e-commerce market size.
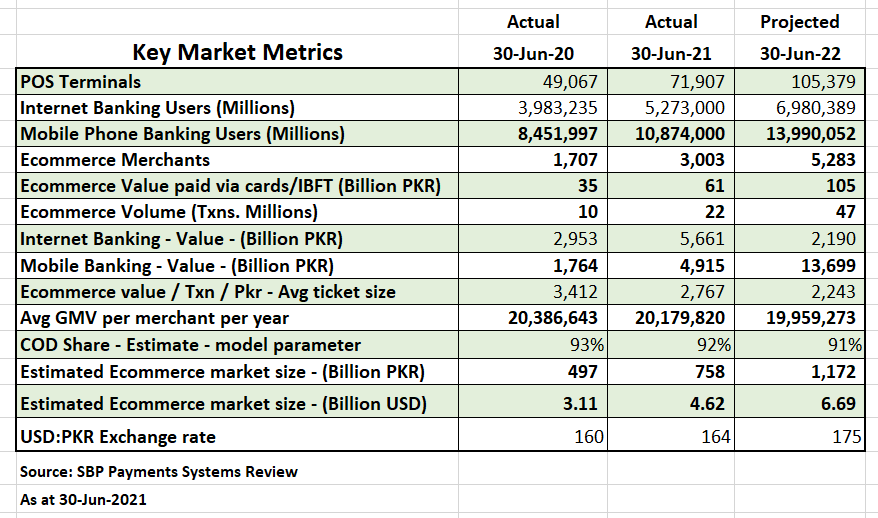
We use primary data from the SBP Annual Payments systems review report (Oct 2021). Among other items its shows the online payments made using cards, IBFT, and pre and post-paid options. We use the following historical SBP market metrics (24 months from July 2019 to June 2021):
- Registered Ecommerce merchant growth
- GMV growth on transactions made using cards or digital payments options
- Mobile banking user growth. Mobile banking transaction value growth
- Reconciled with regional and cross border market size and growth estimates
Growth drivers for the ecommerce market include the growing need for:
- Digital payments that increase consumer comfort
- Last mile plays which provide the consumer with more choices
- Discount driven customer acquisition which offer the consumer lower prices
Rising middle class’ impact on the valuation
Another factor towards an expanding ecommerce market is the demand from the middle class. The urban middle class is growing and there is upward mobility across classes. In addition, an improving technology infrastructure, increasing smart phone penetration and a growing number of small vendors who need active logistics, contribute towards a positive growth outlook for Pakistan’s ecommerce market size.
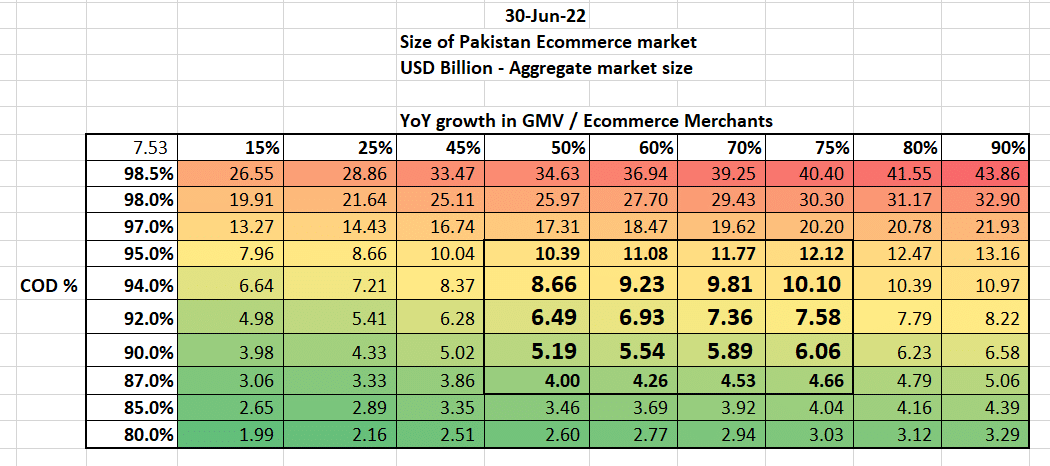
As the SBP payment data only gives the size for transactions paid via cards, to determine the aggregate ecommerce market size this projected ecommerce value is adjusted upwards using an estimate of the share of ecommerce transactions that are settled using Cash on Delivery (COD). That is, Total projected ecommerce market size = Projected ecommerce market size paid via cards/(1-% of COD payments)
Projected e-commerce market size
The resulting projections for FY 2022 ecommerce market size in USD billions for a range of projected growth rates and proportion of payments made in COD are as follows. The numbers in the larger Bold font are the most likely estimates:
ii. Segment Growth rates
Not all segments within the e-commerce market and their growth are correlated with 3PL growth rates. For example, mobility and digital services are key e-commerce segments but they are not correlated to 3PL business.
The growth in topline for large players like Daraz, Food Panda, Careem and Bykea is not correlated because the big 4 own their delivery network. While Daraz is currently a major client for BlueEX, its future growth remains uncorrelated because it plans to achieve 100% in-house logistics and eventually move away from BlueEx.
On the other hand, fashion, personal care, food and consumer electronics are the fastest growing segments within e-commerce in Pakistan. They also have the largest share in this market, fashion alone accounting for 71% of the market. Hence, 3PL’s growth is correlated with growth in these segments as well as with growth in online payments.
Therefore, we assume the logistics segment growth rates to mirror the projected growth rates for the aggregate ecommerce market for FY 2022. Possible rates are between 50%-70%. For each subsequent year of projection, we assume that the growth rates decrease by 10 percentage points per year to account for the resulting increase in the revenue base.
iii. Valuation Multiples
Comparisons for Pakistan’s logistics sector are often made with India and Indonesia. Is Pakistan the next Indonesia?
In logistics and ecommerce, Pakistan tends to be 10% of comparative Indian market size metrics. This serves as a reality check on our own internal estimates for both segments. The Indian logistics market spend was estimated at US$ 390 billion / 8% of GDP in 2021 with the ecommerce market sized at US$ 84 billion.
While Indonesia suffers from a low level of technological integration and a tight bureaucracy, its island-states give intrinsic importance to maritime logistics leading to high valuation multiples for this sector.
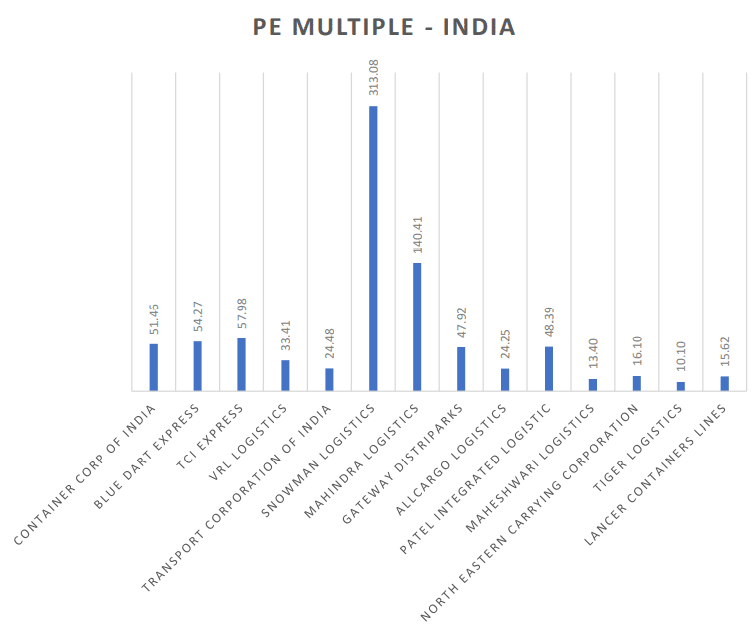
Valuation multiples for the logistics sector in India and Indonesia are as follows:
India
Caveats to using multiples
A few points to note. First, we broadly assume that the PE ratios are consistently defined and calculated for all the companies. This may not actually be the case, companies may be using current PE, trailing PE or Forward PE to define their valuation multiple. Further, accounting basis and management manipulation may also impact the multiples.
Secondly, the 3PL logistics sector in India is highly fragmented with many players. This is therefore a very small subset. Any sample introduces a selection bias into the mix.
Thirdly, if you look at the PS multiples chart below you will see that it includes more companies. This is most likely because companies with negative earnings drop from the PE analysis. Which enhances the selection bias towards more stable longer running companies. By the very nature of the valuation multiple the analysis excludes companies with negative earnings such as startups.
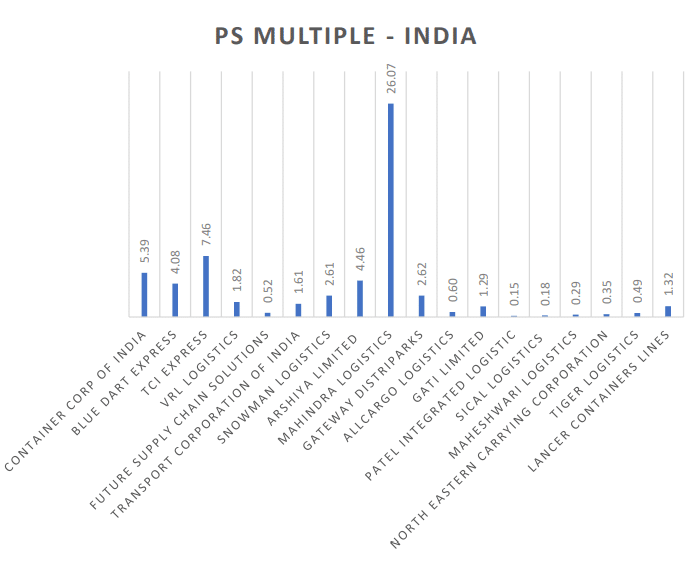
The description of the distribution of selected companies’ multiples are as follows:
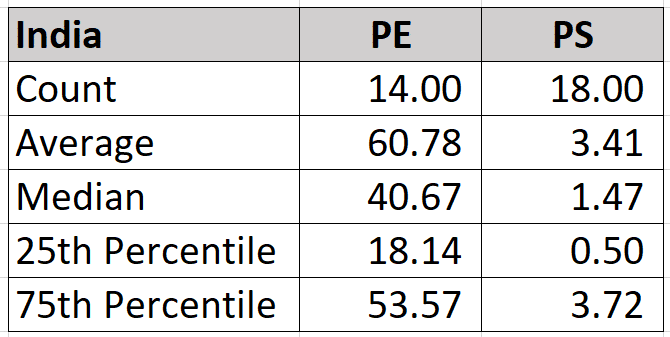
Given that these multiples have a positive skew, i.e., low values of 0 to possibly very high positive values, the Median value rather than the Average PE is a good indication of the PE for the sector. For instance, some top players like Allcargo Logistics and Transfer corporation of India have a PE of 24x while others like Mahindra & TCI Express are much more expensive which skew the results.
Indonesia
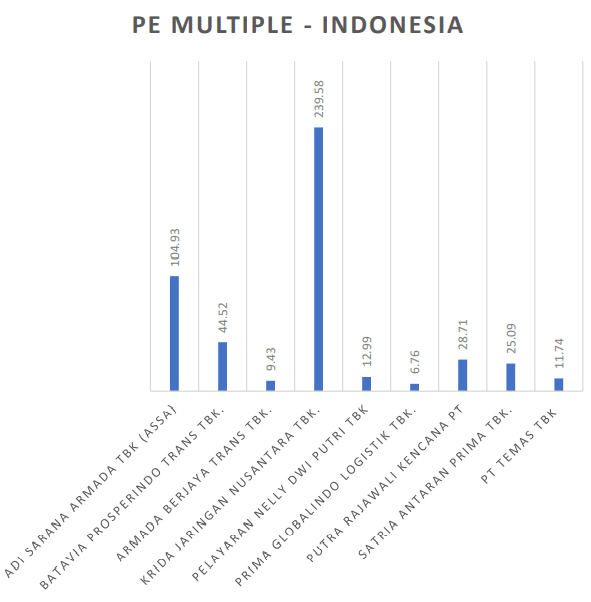
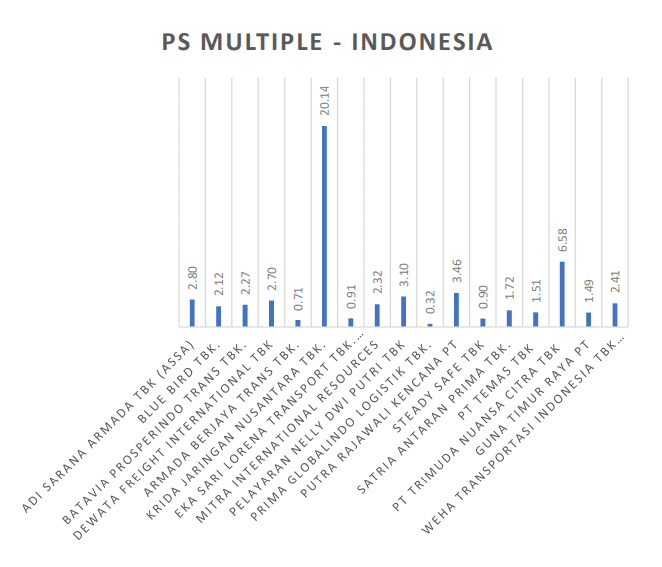
The description of the distribution of selected companies’ multiples are as follows:
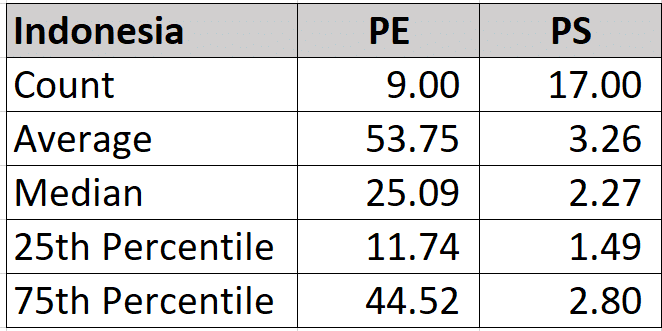
Pakistan suffers problems with liquidity, governance, transparency, policy consistency, and taxation friction and country risk. While it may have better infrastructure and less fragmentation compared to its neighbor, it suffers from lower retail investor participation. These factors therefore, lead to lower valuation multiples.
iv. Scale and network efficiencies
We assume that the injection of capital will lead to improved network and other scale efficiencies that would come with growth. What do faster networks mean for a 3PL company?
Specifically, faster throughput, faster turnarounds lead to better service quality and delivery times. By tracking network capacity, utilization and customer centric metrics in real time, the company can offer competitive pricing for better retention rates and create innovative financing and payment solutions for bigger and loyal customers.
In general, what we measure, improves.
In our model we use a scale assumption, an offset to the growth rate, to project the future cost base. However, we add a further level of conservatism to reduce the benefit of the scale factor. This is to reflect the fact that growth may not necessarily translate to lower cost.
The possible range of scale offsets are in the range 5%-7%. We apply a conservative factor of 0.5% to them.
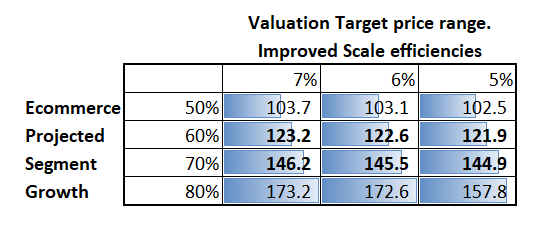
b. Blue Ex Valuation Model and Target Price Results
We combine the impact of ecommerce segment growth and scale efficiencies to generate a range of scenarios. Each scenario projects revenues, cost base, free cash flows to determine an intrinsic DCF based firm value and relative P/E & P/S multiples-based firm values. Then we determine their respective values per share using the outstanding number of shares. Finally, we express the target price as the equally-weighted average of Price to Sales, Price to Earnings and discounted free cash flows firm values per share.