VaR for IRS & CCS – About the EXCEL sheet
The Historical Simulation approach for calculating Value at Risk has become the default approach for us to work with when it comes to non liquid securities linked to liquid primary markets. Long dated cross currency swaps (CCS) and interest rate swaps (IRS) on exotic emerging and frontier market pair fall in this category.
Based on multiple client request, the Value at Risk for Interest Rate & Cross Currency Swaps – EXCEL worksheet is now available for sale. It showcases
1) How to calculate the MTM IRS and CCS portfolios, and
2) How to estimate value at risk using the historical simulation approach for the individual security as well as a portfolio
The sheet evaluates IRS & CCS portfolio VaR figures for an IRS and CCS struck on USD-PKR exchange rate. Navigate through the worksheet with the table of contents that takes the user to the relevant tabs/ data/ outputs within the file as well as to html links for the relevant courses on financetrainingcourse.com.
Here is a quick review of what is on offer.
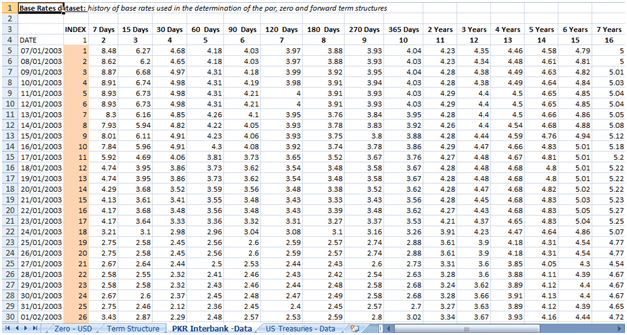
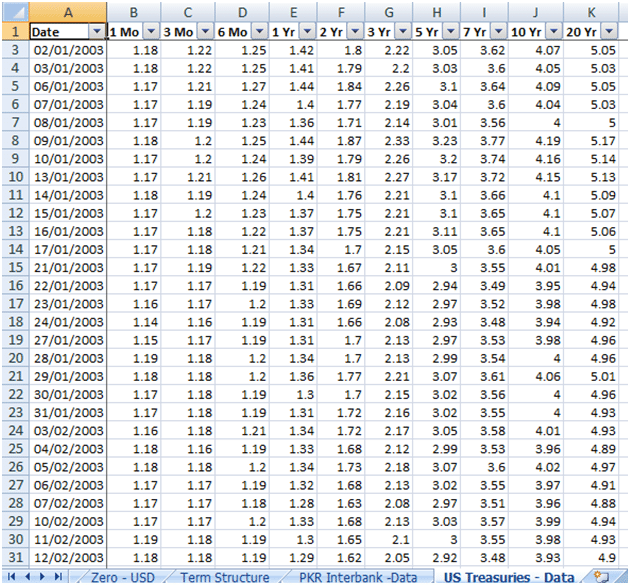
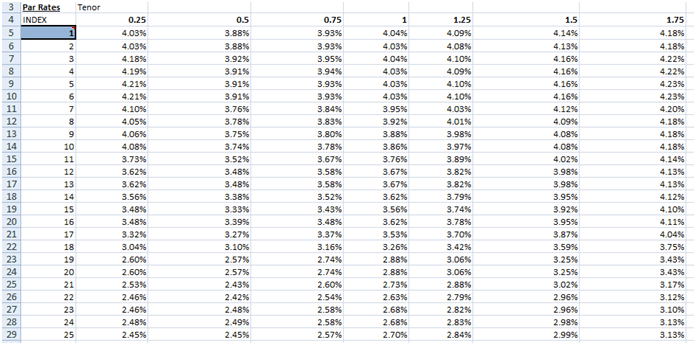
Historical rates tab
Data for PKR interest rates and US Treasury yield data for the years 2003 to 2009 are provided. The worksheet indexes the PKR rate data. Then it uses the indexation for selecting a given day’s data for the purpose of the calculation. The illustrated file works with index numbers 1-180, but the user may use any other set of 180 numbers:
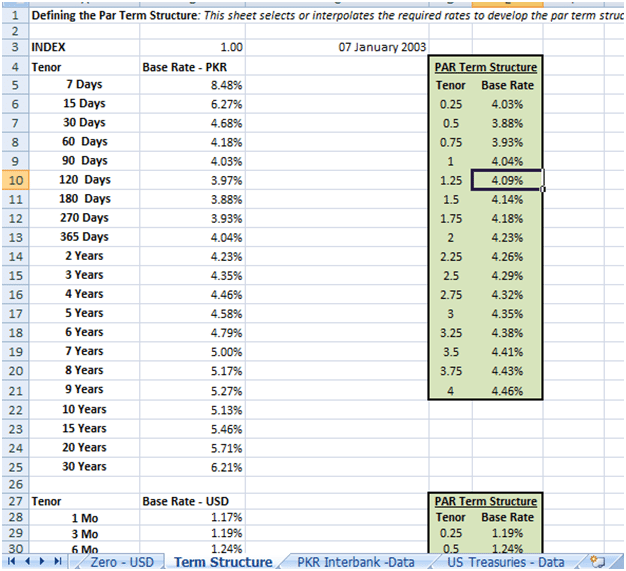
On the tab labeled “Term Structure”, for an index number, the worksheet pulls up the rates for a given date from the Data tabs. Interpolating the respective PKR rates and USD treasuries yields gives the par term structures.
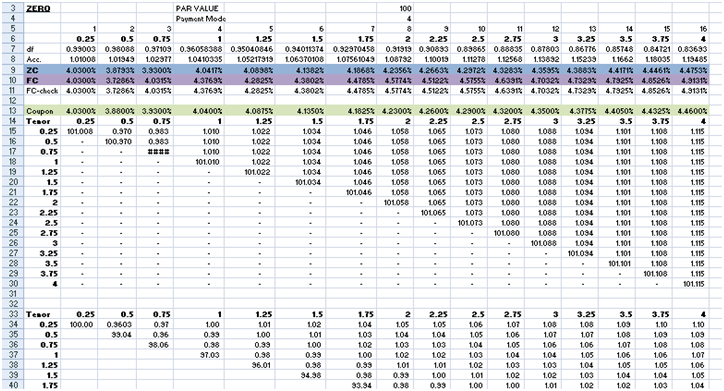
Bootstrapped Zero and Forward Rates
In the “Zero – PKR” & “Zero – USD” tabs, the worksheet then bootstraps the zero rate and forward rates curves from these par term structures:
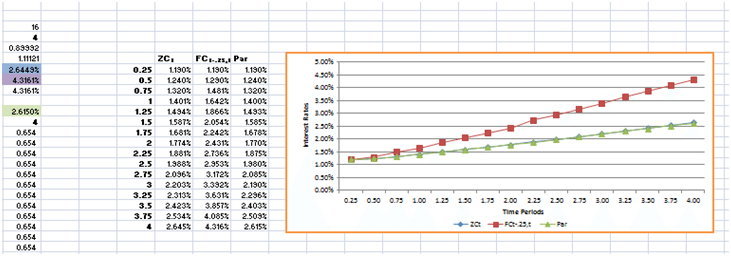
Projected Yield Curves
Also the sheet depicts the derived curves graphically:
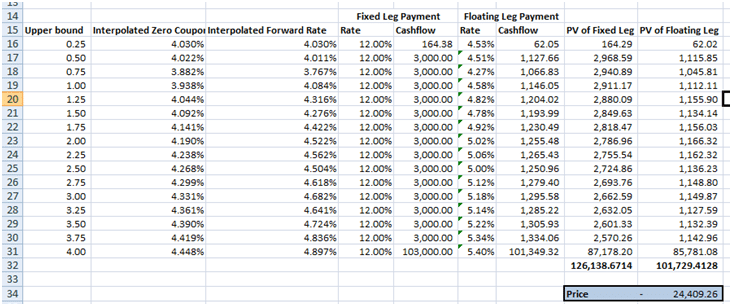
IRS MTM Model
Using the determined PKR zero rates, the sheet prices the IRS:
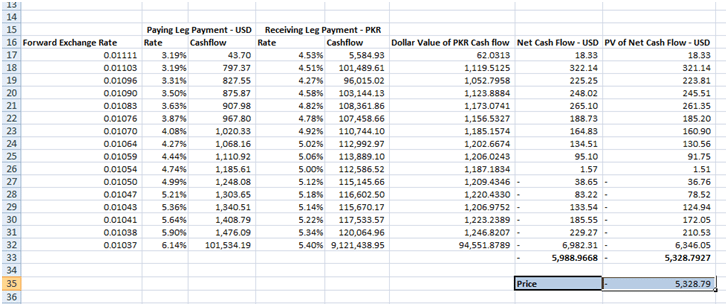
CCS MTM Model
Similarly using the PKR & USD zero rates the sheet determines the price for the CCS:
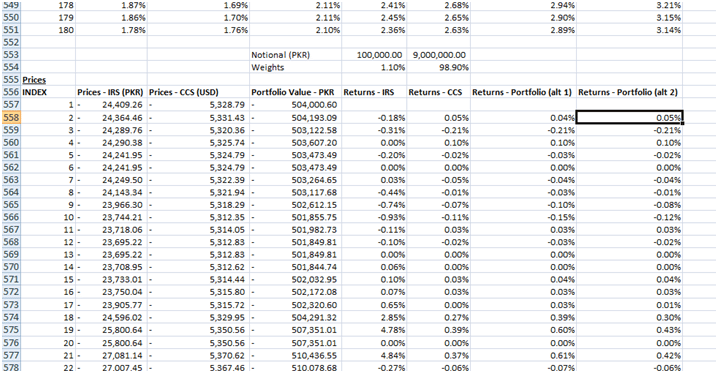
“Results – Rates & Prices” tab is a data warehouse of the interpolated par rates , derived zero and forward rates and the calculated IRS & CCS prices. The sheet uses EXCEL’s data table functionality to store data. First, the index numbers to be used in the calculation are copied and pasted (as values) to all of the seven data tables on this sheet. Then the sheet stores the determined rates and prices against the index numbers:
Interest Rate & Cross Currency Swaps VaR model using Historical Simulation
The sheet then uses the price series to calculate return series for the IRS and CCS instruments. The sum of the individual prices gives the portfolio values. Used this value, the sheet determines the return series for portfolio too. Alternatively, the sheet calculates the portfolio return series by using the notional amounts of the two deals to determine the weights of each instrument in this two-instrument portfolio. These weights, together with the individual securities return series, determine a weighted average return series for the portfolio:
Interest Rate & Cross Currency Swaps VaR Summary Tab
The sheet plots a histogram of returns for each instrument as well as the portfolio. This may be done using EXCEL’s Data Analysis Histogram functionality or in this case, from scratch so that they change with a change in the selection for the index numbers:
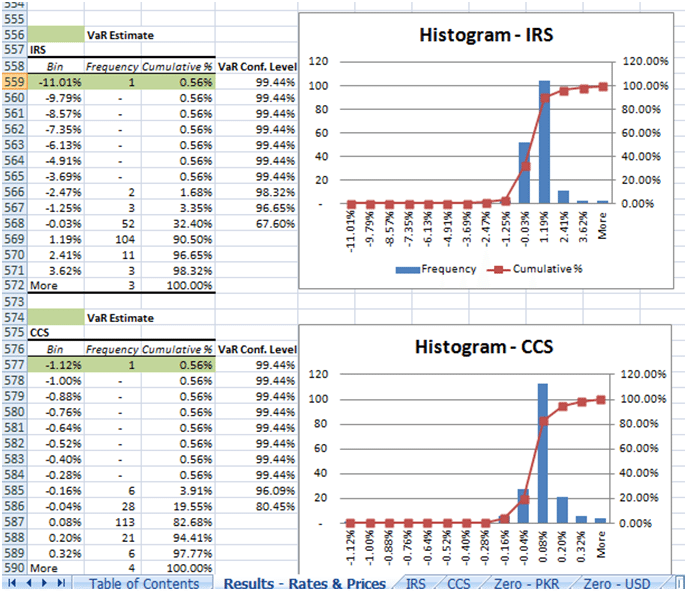
The table output of the histogram gives the worst case loss or the VaR estimate (highlighted in green) together with the confidence level. For example, given the data selection, the daily VaR estimate for CCS is 1.12% at a confidence level of 99.44%.
For a detailed concept walk through of the Excel example check out this post.
Now available for sale – IRS, CCS VaR model using historical simulation