This post is a continuation of our earlier post that describes the usage of historical simulation for VaR calculation of IRS and CCS (Swaps). In this session, we will actually walk through the sample Excel spreadsheet built to achieve that objective. The sheet is built using a simplified IRS valuation model and Excel data tables. Once the concept is clear, you can easily extend this approach to a Cross Currency Swap by upgrading the valuation model for swaps.
As discussed earlier, the Value at Risk (VaR) calculation process is a two step process. In step one we calculate historical MTM using a series of historical rates.
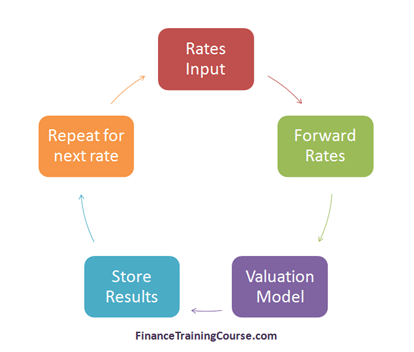
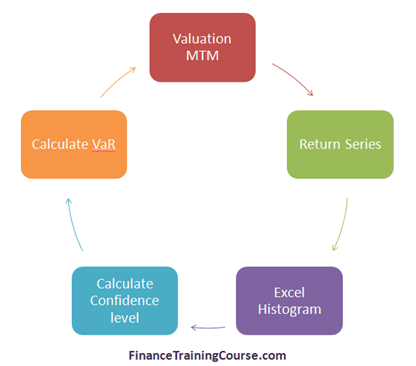
In step two, we use the historical MTM series to calculate daily returns and use this return series to calculate the estimate for Value at Risk for our IRS or CCS.
CCS & IRS Value at Risk – Model Requirements
Our first requirement is an IRS valuation model. You can create a basic sheet to calculate the price or MTM of an interest rate swap. If you are new to this subject, please see the following posts for a quick refresher.
Pricing Interest Rate Swaps – Process. Also, see MTM & Valuation of a simple Interest Rate Swap and Bootstrapping Zero and Forward Curves from treasury term structure data case studies for a step by step guide to building a basic valuation model in Excel.
Note that the model uses a given day’s rate term structure to determine the par term structure. Bootstrap the zero curve from this par term structure then use it to calculate the implied forward curve. Finally, use the forward rates to determine the floating rates for each future date of reset. The difference between the present values of cash flows of the receiving leg and that of the paying leg is the value or MTM of the instrument.
The specification of the interest rate swap that we are using for this case study are as under:
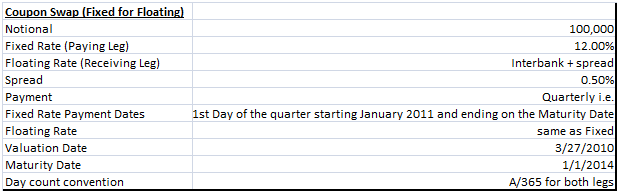
Figure 3 IRS CCS VaR Historical Simulation – IRS Specification
CCS & IRS Value at Risk – Setting the model up for an MTM run using historical rates
Once we have this basic model in place make adjustments so that it can produce a series of results based on the given interest rate term structure for a number of days (e.g. 180 days). In order to do this, we insert a sheet in the EXCEL file to capture the history of base rates used. Assign an index number to each date as follows:
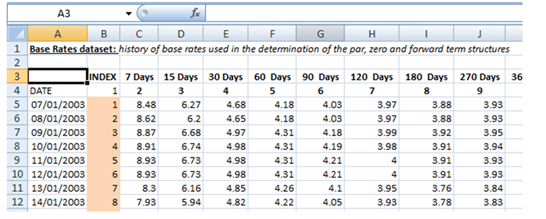
Figure 4 IRS CCS VaR Historical Simulation – Setting up Rates Database
Next, create another sheet that will bring the term structure data in a format the valuation model can work with as shown below. This requires to calculate of intermediate interpolation rates and converting the base rates and maturity tenors to a model readable format.
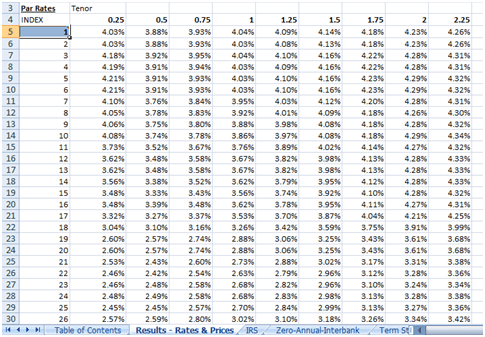
Figure 5 IRS CCS VaR Historical Simulation – Par Rates
With the model setup, we can now use our index numbers and the Excel vlookup function to pick up each complete term structure associated with the relevant index number and feed it to the valuation model. Execute the feed by building and creating multiple excel data tables for:
1) Boostrapped Zero Rates from the valuation model.
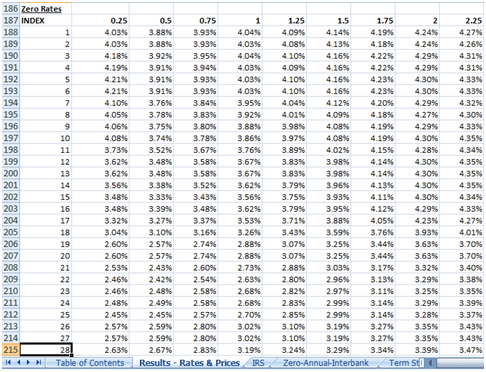
Figure 6 IRS CCS VaR Historical Simulation – Zero Rates
2) Implied forward rates from the valuation model
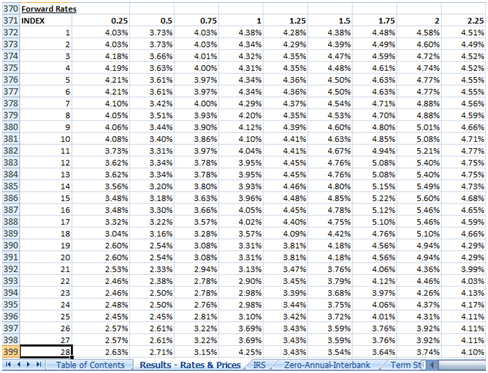
Figure 7 IRS CCS VaR Historical Simulation – Forward Rates
3) The IRS price series from the valuation model
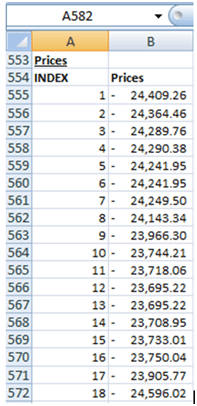
Figure 8 IRS CCS VaR Historical Simulation – IRS MTM Series
Once you have the MTM series for your IRS, your job is more or less done. We take the series and use the Excel Histogram function to estimate Value at risk using the Historical Simulation approach. See Value at Risk – Calculation Refresher for background on Value at Risk and Value at Risk – Historical Simulation in Excel for background on using Data Tables for VaR in Excel.
Excel Histogram tools return us two components. The first is table output. For the IRS in question, the worst case loss at 99.44% confidence level is -11.01% of notional value. At 67.6% confidence level the VaR estimate falls to -0.03%. of notional
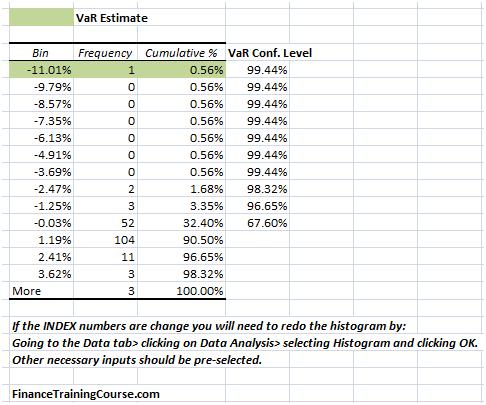
Figure 9 IRS CCS VaR Historical Simulation – VaR Estimates
The second is the chart output which presents the same results in graphical form.
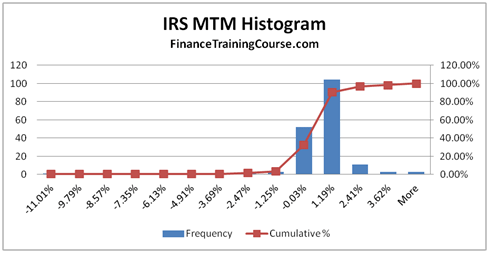
Figure 10 IRS CCS VaR Historical Simulation – VaR Estimate – Chart Output