In our previous post on Dynamic Delta Hedging for European Call Options we built a simple simulation in model in Excel that simulated an underlying price series and a step by step trace of a Dynamic Delta Hedging simulation for a call option.
In this post we will modify and extend the model for European Put options. The basic approach remains the same but a simple modification is required to make the sheet work for European Put contracts.
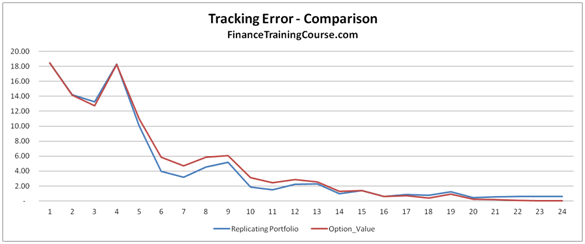
Figure 1 Delta Hedging – Put Options – Monte Carlo Simulation
The end result would be a dynamic simulation graphical output showing the original option value and the replicating portfolio that is created to hedge it.
If you remember, our Dynamic Delta Hedging strategy for Call Options relied on going long (buying) Delta x S and financing this purchase by borrowing the difference between our purchase and the premium received for writing the option. This strategy defined the structure of our Monte Carlo Simulation spread sheet in Excel.

Figure 2 Delta Hedging – The baseline model and simulated values
Delta Hedge – Put Options – Tweaking the original Monte Carlo Simulation model
How would you change this model for hedging a European put contract?
In a call option the probability of exercise goes up as the underlying price goes up. For a put option the opposite is true. For a call option as the probability of exercise goes up, we buy portions of the underlying to hedge our exposure and manage our dollar cost average purchase price.
For a put option therefore we short more of the underlying as probability of exercise goes up ( the probability is N(d2) for a Call, N(-d2) for a Put) and vice versa when the probability goes down.
For a call because we are short cash we borrow it to finance our purchases. For a put option the short sale of the underlying generates cash and we invest the proceeds for the duration that we remain short.
Therefore the structure of our dynamic delta hedging sheet for a European put contract changes and becomes:

Figure 3 Dynamic Delta Hedging – Baseline model for European put options
The only difference are:
a) In the replicating portfolio: Where we are now short Delta x S and have lent the proceeds from the short sale
b) Option Delta calculation where we are using N(d1) – 1 rather than N(d1) as the option delta for a put option.
As per our earlier model we still need to simulate:
a) The underlying stock price
b) Option Delta for a put option linked to the underlying stock price
c) Replicating portfolio comprised of a short position in Delta x S (Spot price of stock) and a long position in Borrowing B.
d) Difference between the replicating portfolio and the option value to calculate tracking error.
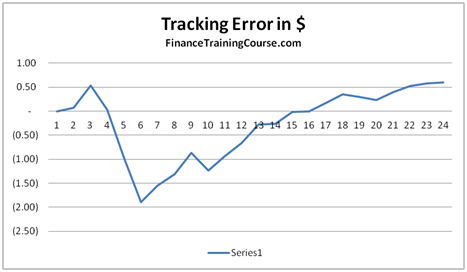
Figure 4 Delta Hedging – Put Options – Tracking Error
If you are unfamiliar Monte Carlo Simulation please see the Monte Caro Simulation Training Guide below as well as our posts on Monte Carlo simulation before proceeding further.

We use Barclays Bank and assume that the bank will pay no dividends over the life of the option.
Delta Hedging Model using Monte Carlo Simulations – Assumptions
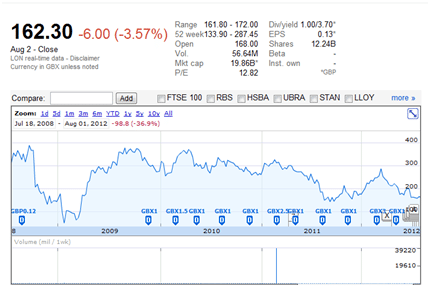
Figure 5 Dynamic Delta Hedging – Barclays bank price chart
Delta Hedge – Put Contract – Simulating the underlying using Monte Carlo Simulation
We will assume that the spot price is 162.3, the strike price 150, the daily volatility will range between 2.5% to 5%. Implied annualized volatility will be assumed to be 40%. Risk free rate of interest will be 1%, time to maturity will be one year. As discussed above, the stock will pay no dividends.
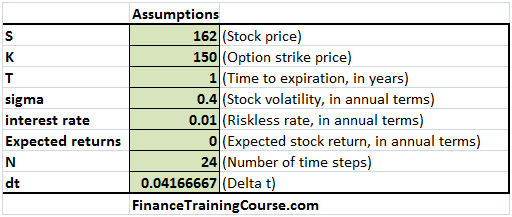
Figure 6 Delta Hedging – Key Assumptions
Using the above assumptions simulate a path of Barclays share price over the next one year. For each value of the underlying stock price we also calculate d1 using the standard Black Scholes European option pricing.
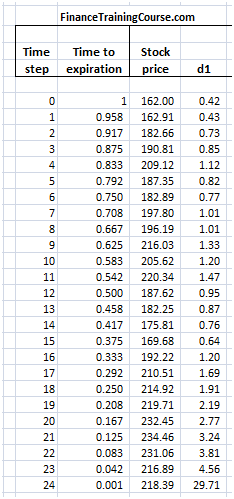
Figure 7 Delta Hedging – Put Option – Simulating the underlying
The actual stock price simulation with the original discrete formula and the Excel implementation is shown below and is the same as the approach used earlier for Delta Hedging. The only difference is that our Delta Hedging sheet worked with a 12 step forecast. For put options we are using a 24 step simulation.
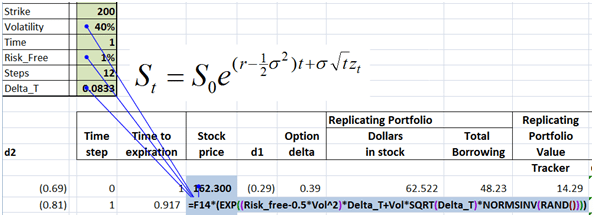
Figure 8 Delta Hedging – Simulating the underlying
Armed with d1 we can now calculate option delta as well as the value of the replicating portfolio (Short Delta x S + Total lending).
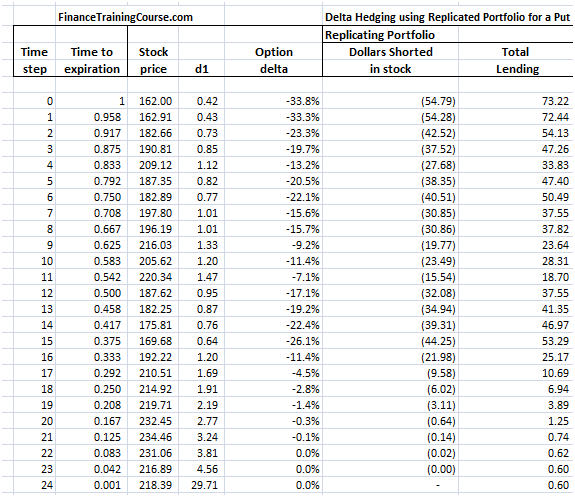
Figure 9 Delta Hedging – Put Option – Completing the Picture
Delta Hedge – Put Contract – Calculating the amount lent for each time step
The dollars shorted calculation is simple (Delta x S), it is the total lending calculation that requires some attention.
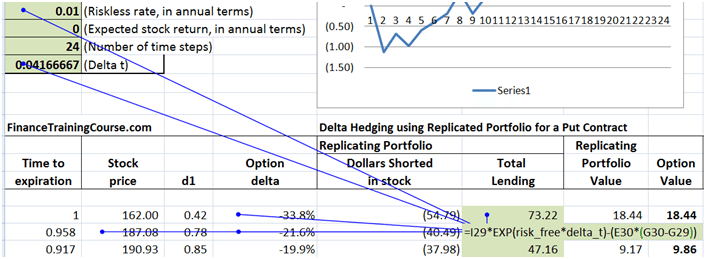
Figure 10 Delta Hedging – Put Option – Calculating Amount lent
The calculation at time step one is simple. We receive $18.44 in premium. Our short position generates $54.79 in cash. The total cash available is 73.22. We immediately lend it at the risk free rate. But what happens at step two in the image above. Price jump to $187.08 and our delta falls to -21.6% from -33.8%. Our short position declines from $54.79 to $40.49. Where does the approximately $14 change comes from?
The original balance at time 1 has grown at the risk free rate for the time step in question (one time step). However the incremental change in stock is given by the change in Delta (G30 – G29) times the new underlying stock price. The way the formula is structured is such that it will release cash when the stock price rises (Put Delta gets less negative) and consume cash when prices decline (Put Delta get more negative).
Put Option – Delta Hedging – Putting the rest of the sheet together
The rest is exactly the same as before. The replicating portfolio is given by (-Delta x S + Amount lent). The option value is calculated by the standard Black Scholes Put Option premium calculation.
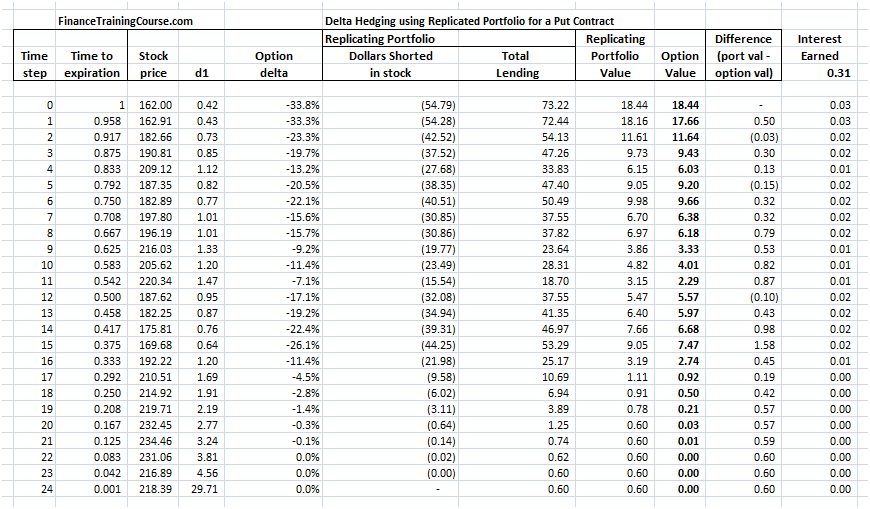
Figure 11 Delta Hedging – Put Option – Total Spreadsheet view

Comments are closed.