The relative value framework speaks.
Gold has historically been viewed as a store of value but given its price volatility over four years that role is increasingly being questioned. If that underlying assumption is true, price of gold should adjust to reflect the loss in value of baseline currencies and benchmark commodities. Our relative pricing model presented earlier is a possible framework that can be used to gauge Gold’s value by comparing gold prices against a range of industrial commodities.
The relative pricing framework tracks prices of the commodity in question against a range of other commodities and currencies to see how current “relative price” ratios compare with historical averages. If you are above the historical average you are overvalued, if you are below you are undervalued. While the framework is simplistic in nature valuation signals from a basket of commodities and currencies add up. While we don’t use it as a trading signal, it generates a great deal of entertaining discussion at our desk. We would love for you to jump in too in that discussion.
Data set sources
The prices of gold and silver were taken from the onlygold.com and kitco.com respectively.
Gold prices– Price Trends
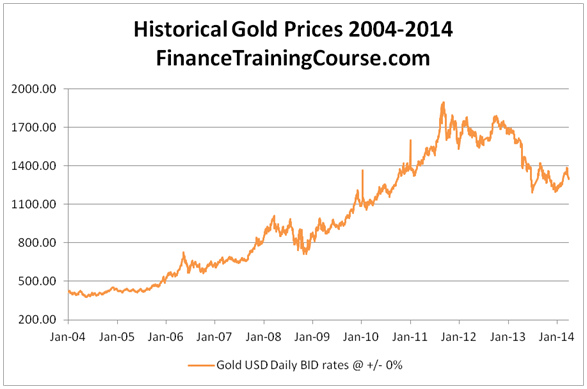
Figure 1 – Gold Historical Price Trend
Changes in gold prices signaled key transition points in the global economy. The impact of Iraq-Afghan wars, the 2008 recession, and the USD Euro melt down.
The relative pricing model – how may barrels of oil can an ounce of gold buy?
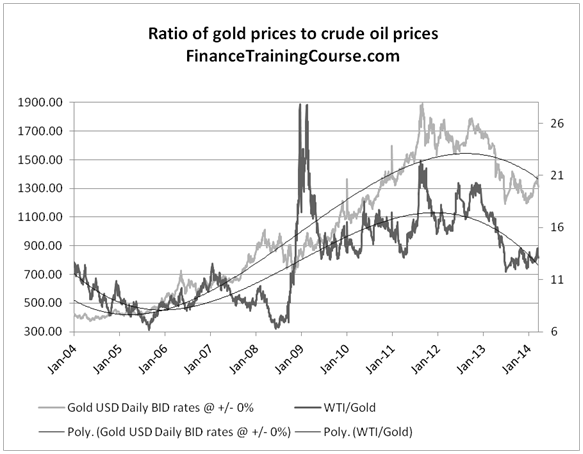
Figure 2 – How many barrels of oil can an ounce of gold buy?
Gold and oil prices (roughly) followed the same direction and trend. However, the gold to oil ratio (how many barrels for an ounce of gold?) peaked slightly north of 21 barrels per ounce of gold. At its current value of 13 barrels, it is still significantly higher than the historical average trend that hovers around 8 barrels.
Gold to Oil Ratio signal – Overvalued
Gold prices and the EUR USD exchange rate
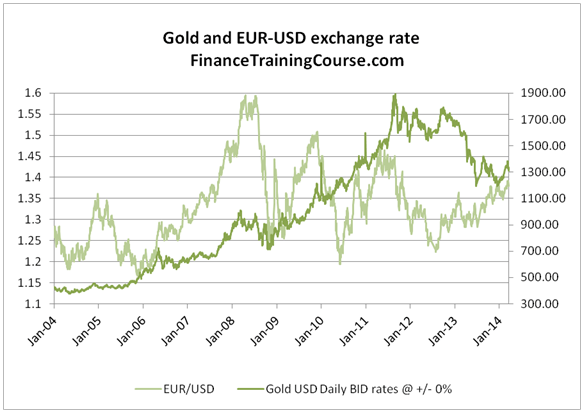
Figure 3 – Gold versus the EUR USD exchange rate.
As Europe and euro recover and memories of the euro meltdown fade, gold prices adjust to reflect the new strength of the European currency.
EUR-USD signal – neutral
Gold prices against AUD-USD exchange rate
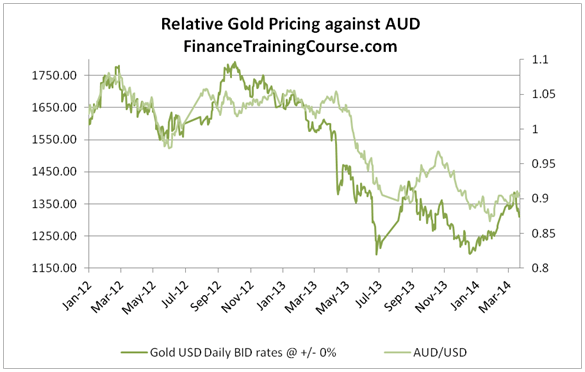
Figure 5 – Gold and AUD.
Australian dollar is a commodity driven currency that does well when commodities do well.
AUD-USD signal – slightly bullish
The Gold and Silver Ratio
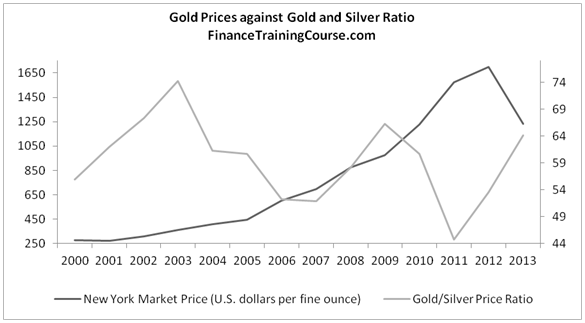
Figure 6 – Gold Silver ratio
Gold Silver ratio signal – slightly bullish
Gold versus Industrial Commodities
The relative price argument holds for a large number of commodities and is not limited to just oil, silver and gold.
Relative price of Natural Gas against Gold
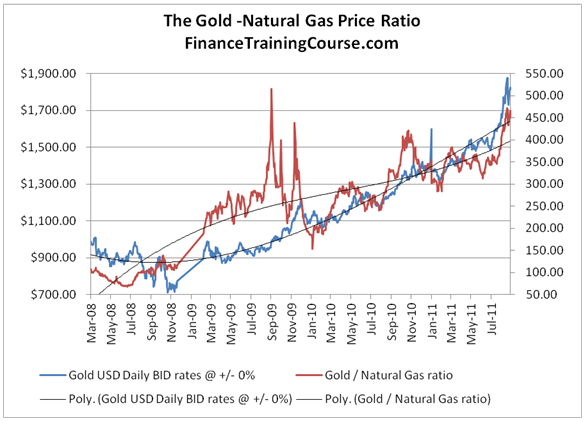
Figure 7 Gold and Natural Gas – The energy bucket
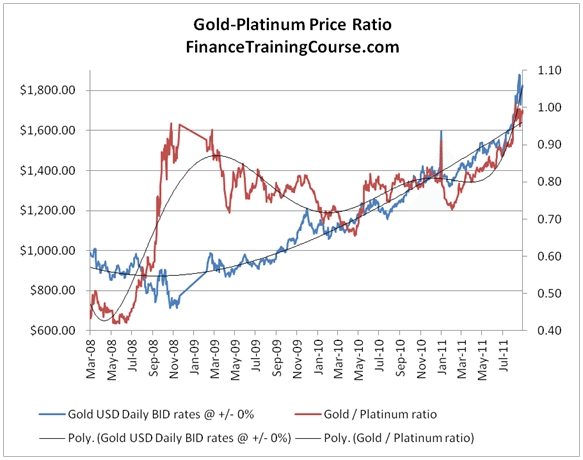
Relative Price of Platinum against Gold
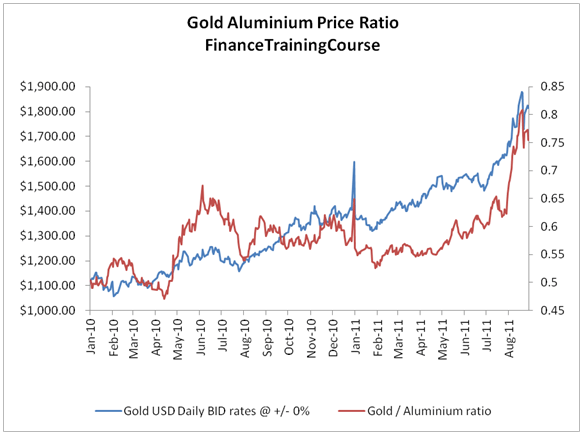
Aluminum against Gold
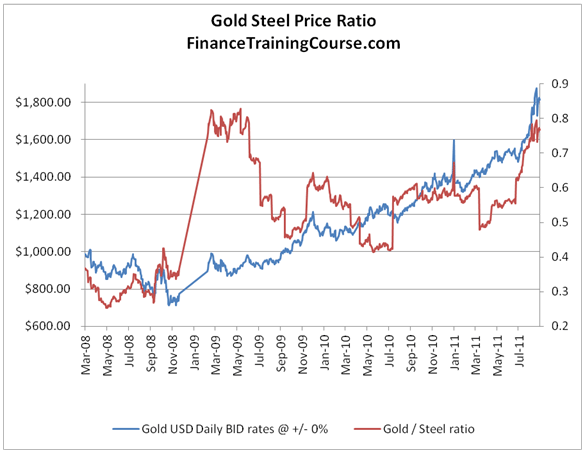
Steel against Gold
So where do you think gold is headed next?