N. N. Taleb explains Alpha or the Gamma Rent, in his book Dynamic Hedging, as ‘Theta per Gamma ratio’. At first the concept is quite difficult to grasp but when we reduce the risk free rate and the dividend yield rate to zero, the equation starts to become more edible.
Equation
In the Black Scholes model, alpha is calculated using the following equation:
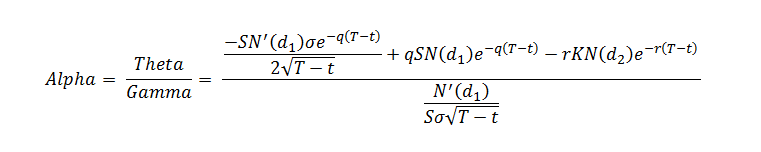
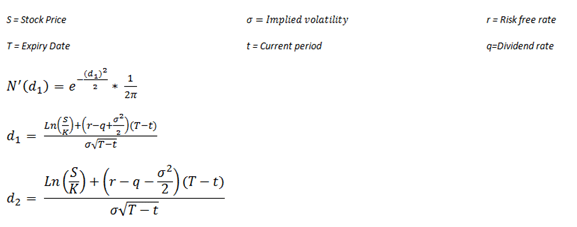
Where:
Now lets look at it for zero risk free rate and zero dividends:
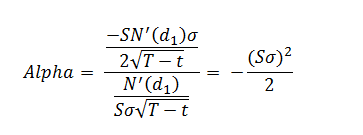
This is called the ‘Fair Alpha’ and in this exercise, we will be looking at creating the surface for this Fair Alpha.
Why do we need Gamma Rent?
Gamma rent is a measure of earnings from gamma for one dollar invested in an option for a single day. It represents the opportunity cost born by the investor for the day, with high gamma rent signaling a high cost and vice versa.
Creating a surface for Alpha
Let us consider the following annualized implied volatilities, and strike prices for options of stock price of $15.7 on NVIDIA’s stock (NVDA) for January 31, 2014. We are also assuming zero risk free rate and dividend yield rate. The source of implied volatility and strike price data is ivolatilty.com and for stock price, the source is finance.google.com. We will first plot Alpha using zero interest rates and then replot the same surface using non zero rates.
The parameters for option payoffs are as under:
| Spot Prices | Strike | Time to maturity | Time in years |
| $ 15.70 | $ 6.28 | 30.000 | 0.083 |
| $ 15.70 | $ 7.07 | 60.000 | 0.167 |
| $ 15.70 | $ 7.85 | 90.000 | 0.250 |
| $ 15.70 | $ 8.64 | 120.000 | 0.333 |
| $ 15.70 | $ 9.42 | 150.000 | 0.417 |
| $ 15.70 | $ 10.21 | 180.000 | 0.500 |
| $ 15.70 | $ 10.99 | 360.000 | 1.000 |
| $ 15.70 | $ 11.78 | 720.000 | 2.000 |
| $ 15.70 | $ 12.56 | 1,080.000 | 3.000 |
| $ 15.70 | $ 13.35 | ||
| $ 15.70 | $ 14.13 | ||
| $ 15.70 | $ 14.92 | ||
| $ 15.70 | $ 15.70 | ||
| $ 15.70 | $ 16.49 | ||
| $ 15.70 | $ 17.27 | ||
| $ 15.70 | $ 18.06 | ||
| $ 15.70 | $ 18.84 | ||
| $ 15.70 | $ 19.63 | ||
| $ 15.70 | $ 20.41 | ||
| $ 15.70 | $ 21.20 | ||
| $ 15.70 | $ 21.98 | ||
| $ 15.70 | $ 22.77 | ||
| $ 15.70 | $ 23.55 | ||
| $ 15.70 | $ 24.34 | ||
| $ 15.70 | $ 25.12 |
To create the surface, we need to start by calculating the values for Alpha for the above grid. The process uses the following steps: 1) Calculate d1 and d2, 2) calculating N'(d1), 3) calculate Gamma, 4) calculate Theta and finally 5) Theta-Gamma ratio the Alpha. Since we have repeated this exercise a number of times for calculation of volatility surfaces earlier, we will speak the actual implementation. The one point that you should remember though is that while you don’t the same process for Fair Alpha (you can skip 1 – 4 and go straight to Alpha with an estimate for implied volatility), once you start playing with non-zero rates, you would need the full solution.
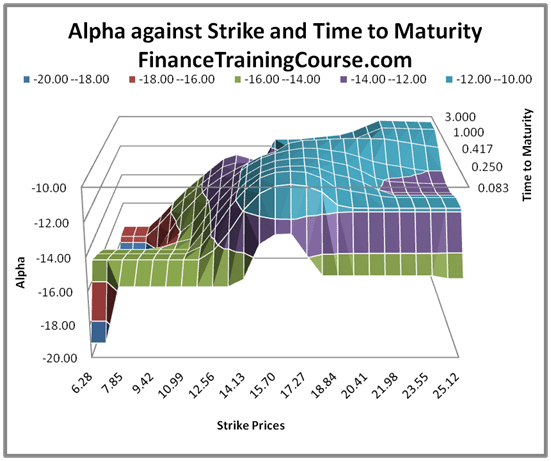
Figure 1 Fair Alpha Surface plot