1. What is Vega?
Vega is the change in the value of the option with respect to change in volatility.
Within the Greeks, in particular, option volatility greeks, Vega’s importance rises given how misunderstood the behaviour of volatility is. Also, the impact changes in volatility have on option prices. In earlier posts we have seen:
a) Implied volatility is not constant.
b) Deep out of money options react very differently to changes in implied volatility and
c) Volatility ends up behaving as a function of time to expiry and money-ness. We used implied volatility surfaces to plot the behavior of volatility across these two dimensions.
In this post, we will take a deeper look at Vega and its two associated option volatility greeks or derivatives. We will also examine Vega’s relationship with Gamma. As part of this exploration process, we will introduce the concept of Shadow Gamma and Vanna – both instances of what we could call cross Greeks. Since by now we have spent sufficient time with the concept of surface plots, we will also add a new dimension, the underlying asset price, to our surface plots.
a. Calculating Vega
The following is the equation for calculating:
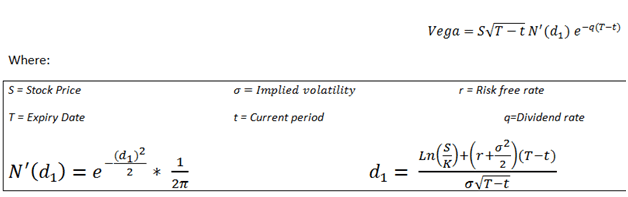
Since assume no dividends, the formula simplifies to:
We can use either of the two equations to calculate Vega. Similar to Gamma, the value of Vega is the same for both call and put options.
For example, let us consider a call option on Tesla stock with the following particulars:
- Current date (t) = 10-December-2021
- Current stock price (S) = US$ 1,017.03
- Option expiry date (T) = 7-January-2022
- Strike price (K) = US$ 1,750
- Implied volatility = 85.40%
- Risk free rate = 0.27%
- Dividends = 0%
Time to expiry works out to T-t = 0.08 years
We first calculate d1 & N'(d1):
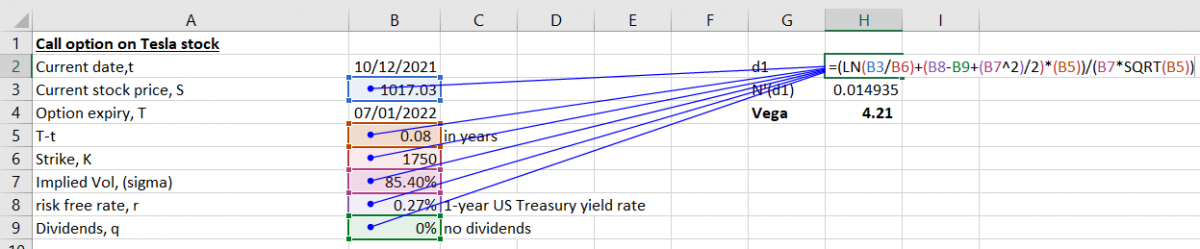
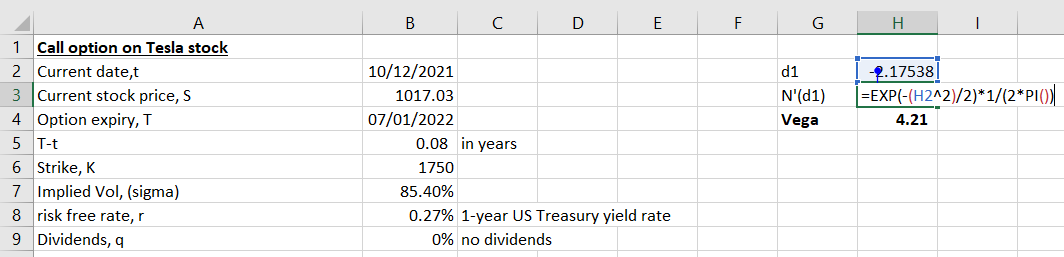
Then we calculate Vega:
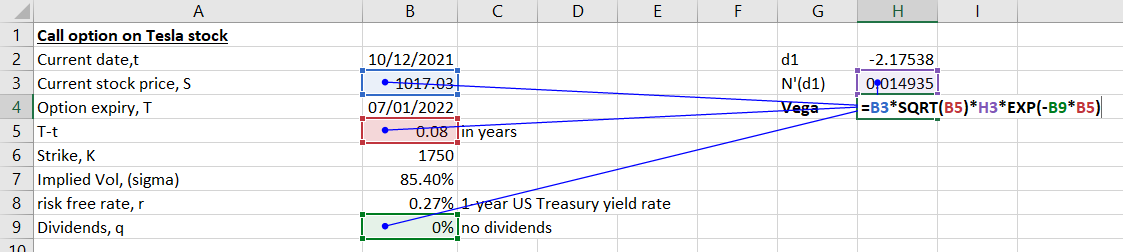
The Vega for the call option on Tesla stock works out to 4.21. This means that the call option price on Tesla’s stock will change by US$ 4.21 when the implied volatility in the underlying stock changes by 1%.
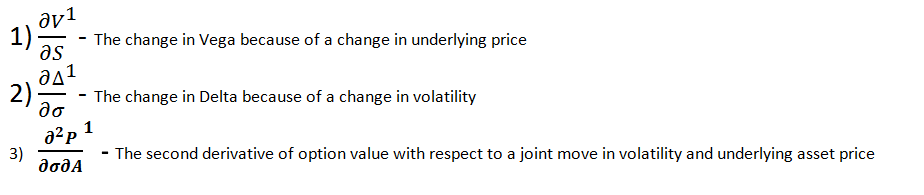
2. Vanna – Volatility’s cross Greek
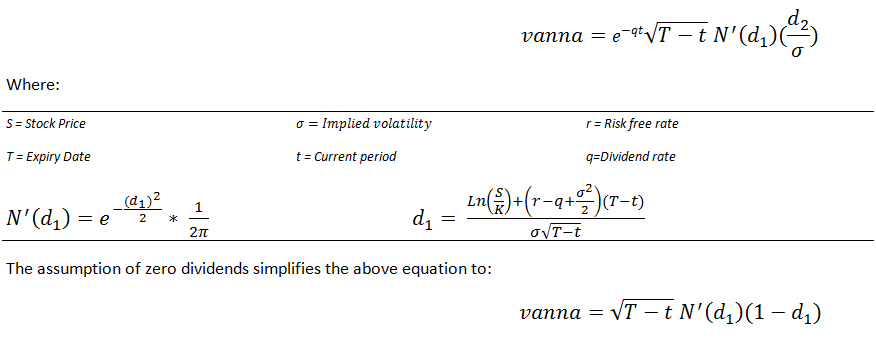
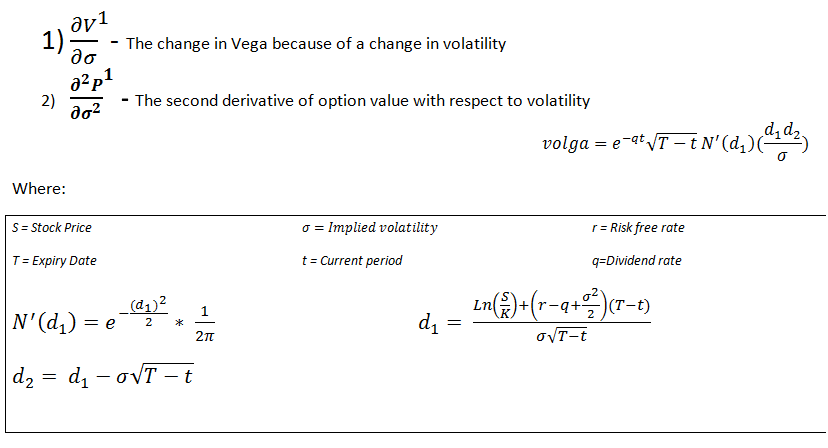
Vanna, a second order cross Greek, can be defined as:
a. Calculating Vanna
In the Black Scholes model, calculate Vanna using the following equation:
We continue with the example of call option on Tesla stock. First we calculate d2:
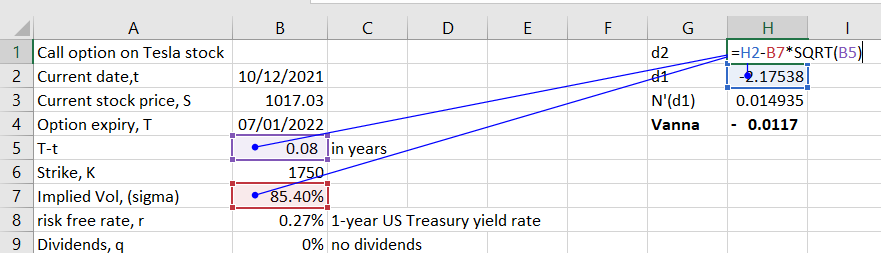
We then determine Vanna for the option as follows:
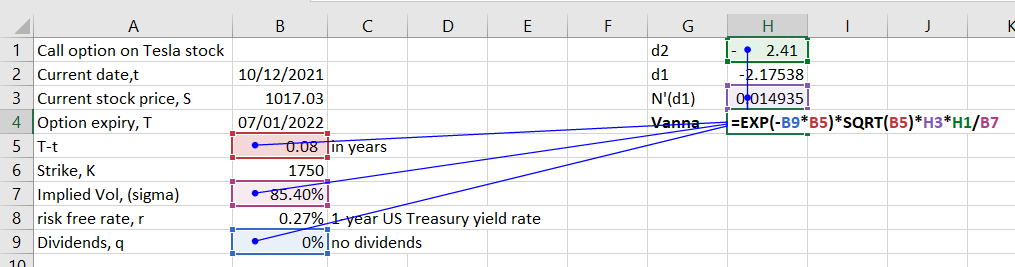
The Vanna for the call option on Tesla stock works out to -0.0117. This is the rate of change in Delta and Vega as the volatility and the underlying asset price changes.
3. Volga – Volatility Gamma
Volga or Volatility Gamma determines the rate of change in Vega on account of a unit change in volatility. The same relationship convexity has with duration and gamma has with delta.
a. Calculating Volga
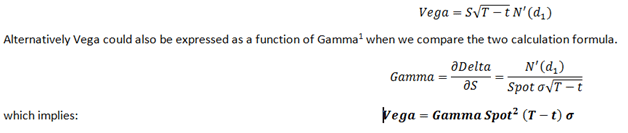
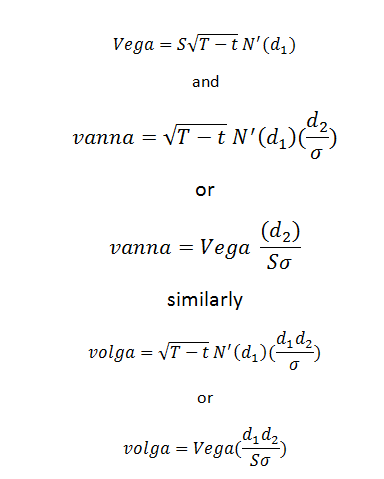
It is also possible to express both Vanna and Volga in terms of Vega.
We know that Vega is given by:
Continuing with our Tesla call option example we calculate its Volga as follows:
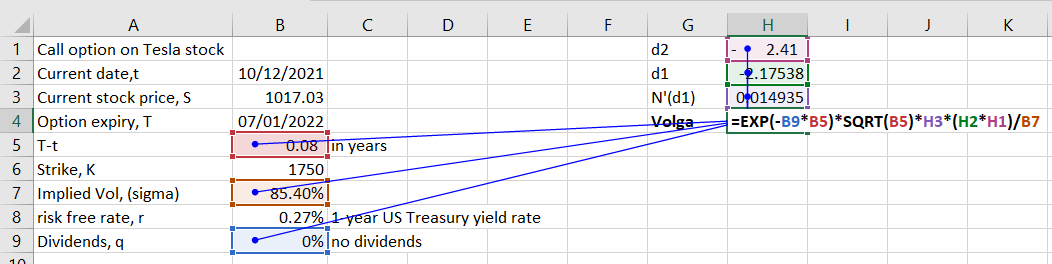
For a unit change in volatility, the rate of change in Vega for the call option on Tesla stock is 0.0254.
The formulas for Vega, Vanna & Volga above indicate a direct linkage with time. Unlike Gamma where Gamma peaks with a reduction in time for at the money option, for Vega, Volga and Vanna, it is increasing the time that gives volatility an opportunity to impact option value. The Vega Greeks will decline as the time to expiry comes closer to zero. This creates different choices that need to be balanced when we try to hedge Gamma and Vega together.
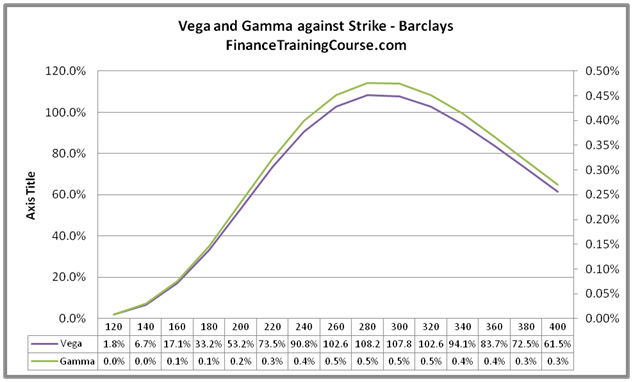
4. Plotting Vega and Gamma
The plot below calculates the values of Vega and Gamma for an option against changing the levels of the strike price. In this specific case, the current spot price lies between 270 and 280 which is where (at and near money) where Vega peaks. Despite the fact that we have a different scale for measuring Vega and Gamma, the interesting thing in the above graph is the similarity in shape for the two Greeks.
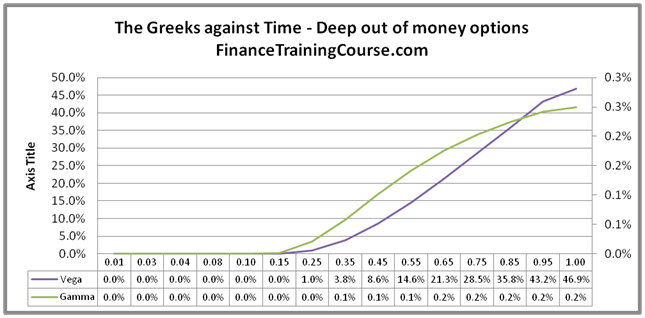
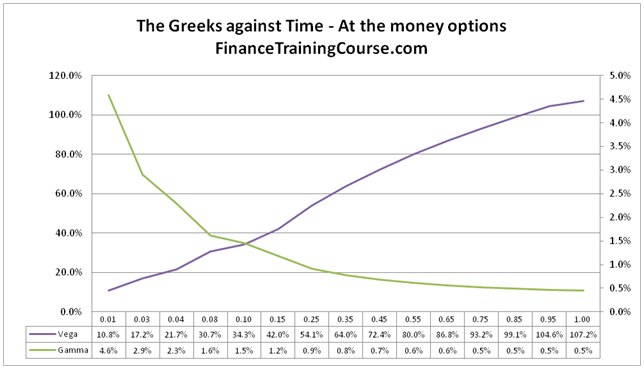
5. Vega and Gamma against time
It is when we plot Vega against changing expiry for deep out of money options and at money options that we see a difference emerging in the relationship between Vega and Gamma. For deep out of money option reducing time to maturity reduces both Vega and Gamma.
For at the money option, the impact of time on Vega and Gamma is the exact opposite. Vega rises as we increase time to expiry. Gamma rises as we decrease time to expiry.
xProduct()