The Price to Sales ratio is a valuation measure for assessing if a company is over-/ undervalued. It is a valuable screening tool to flag investments for additional deep dive investigation.
What is the Price to sale ratio?
The Price to Sales ratio compares market capitalization of an entity against its past 12 months total sales or revenue. It indicates the years it takes for sales to equal market capitalization. Alternatively, how much the investor will pay for every unit of revenue generated. It is calculated as:
PS ratio = Market Capitalization/ Total Sales, or
PS ratio = Share price/Sales per share
The ratio used for selecting stocks for investment, was popularized by Kenneth L Fisher in 1984. His premise, lower PS ratios are better. Because any improvement in the company’s performance will boost the value of the stock. The comparison is relative to historical averages for the industry as well as for the company itself. A low PS ratio on a relative basis may indicate that the market is undervaluing the company. Thus, there is potential for the company to yield a higher above average return over the longer term.
Comparison with Historical Averages
To illustrate the concept, we assess Citigroup’s PS ratio against a rolling 5-year average of its past PS ratios as well as those of the industry.
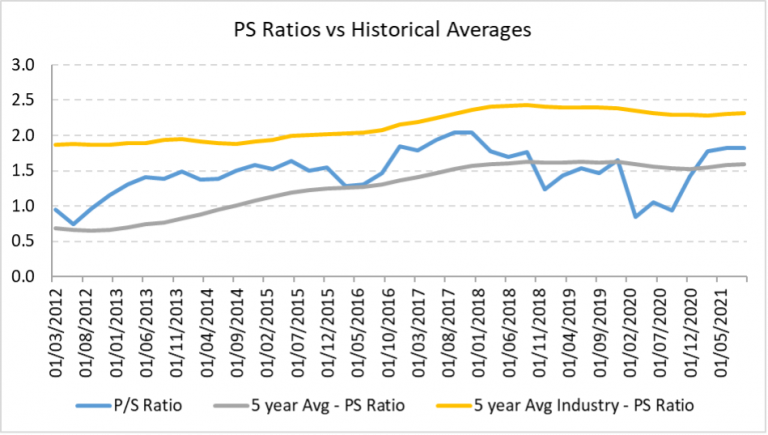
For simplicity, in the graph above, we have used Goldman Sachs as a proxy for the industry averages. Evaluating against its past average, Citi’s PS Ratio is currently higher. Compared to the industry, however it is lower. Therefore, investors may consider book marking Citi for further investigation. PS ratios can be an effective tool for short listing investments for a more in-depth analysis.
The PS Ratio analysis based on past averages assumes that Citi’s growth and profits are relatively stable over time. If not, we should consider additional factors like cost structure, debt and profitability. Further investigation is important because many companies with low Price to Sales ratios have high debt burdens and low profitability.
While we will look at these factors separately below, some studies suggest ways of tweaking the P/S ratio to remove some of limitations of the traditional valuation metric. For example, Vruwink, Quirin & O’Byran suggest modifying the price to sales ratio to reflect profitability and long term debt. A base profitability assumption is set for the traditional PS ratio. Then, the company’s actual profitability in relation to this assumption is applied as a multiple to modify the measure. For long term debt, the company’s “enterprise value”, sum of market capitalization & debt, will be the numerator instead of price. Again, the lower the modified ratios the better the opportunities for above average returns over the long run.
Increasing PS ratios over time may be an outcome of market trends and changing dynamics. Or, investor speculation or an increase in the company’s market share.
Evaluating the Price to Sales Ratio against other measures
Using the PS ratio on its own to make investment decisions is meaningless. It is important to look at other factors and metrics.
Debt load
You cannot differentiate between leveraged and unleveraged companies by simply looking at their PS ratios. So, it is important to consider the amount of debt these companies have on their books. Hence, while the rule of thumb may be that a company with a lower PS ratio is a more favorable investment, a highly leveraged company with a low PS ratio may be close to bankruptcy. For example, we have the recent case of China Evergrande Group. According to Yahoo Finance the company has a very low price to sales ratio of 0.07 (16-09-2021). However, the second largest real estate property company in China is near collapse. A liquidity crisis impacts its ability to meet $300 billion in debt obligations.
Growth rate
How fast can a company grow revenue? How much of the growth is funded by borrowings?
Let’s take the case of PayPal. The pandemic benefited this payment services company. They saw revenues grow by 21% in 2020 year on year. A result of more people embracing ecommerce, an increase in digital sales and online consumption; a greater need for cashless/ contactless transactions. They grew their customer base, entered strategic partnerships, made acquisitions, and introduced new revenue streams (including cryptocurrencies). On the other hand, their peers, behemoth companies like Mastercard and Visa, suffered declines in revenue. 9% and 5% respectively, over the same period primarily due to a decrease in cross border activities and travel.
However, this recent growth has been funded with debt. Prior to 2019, PayPal relied only on credit facilities. Since then, they have issued long term fixed rate debt in 2019 and 2020. Long term debt stood at $5 billion and $9 billion as of year ends 2019 and 2020 respectively.
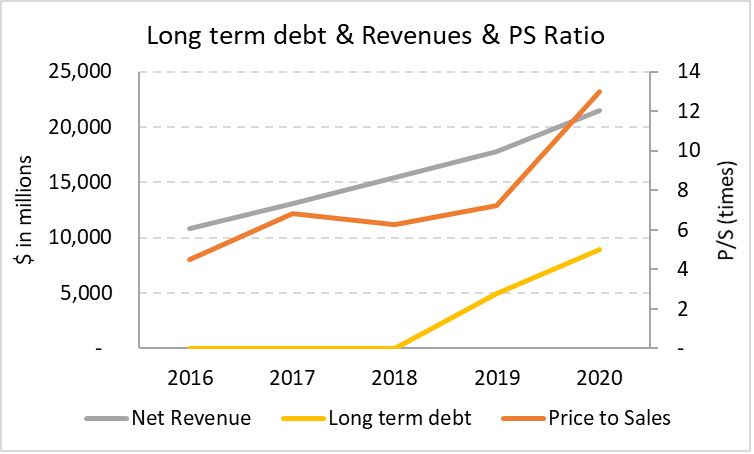
Debt service costs have also increased. The graph below plots the Debt Service Coverage ratio against the Price to Sales ratio. As you can see the DSCR has declined as PS ratio has increased. The DSCR which informs how many times the operating income can cover debt service costs is now close to one. 1.02 in 2020 against 1.84 in 2018 and 2.16 in 2017.

Profitability
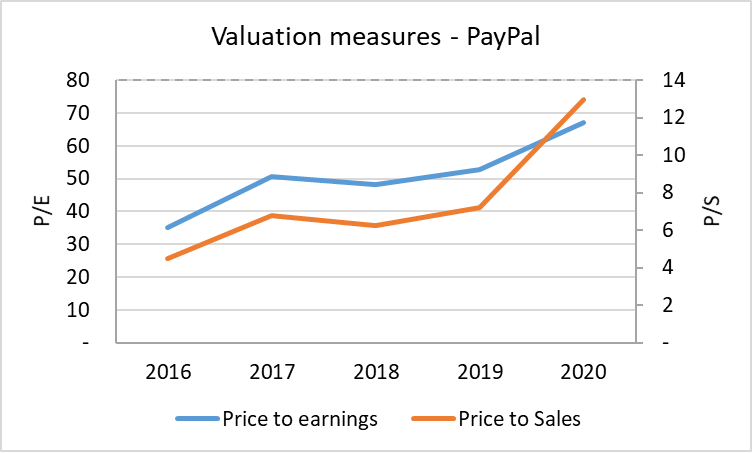
PS ratios may go up as investors bid up the price of the company on expectation of future sales. Which would translate to a higher bottom line. In the case of PayPal, expectations for higher future sales and revenue has driven up both valuation multiples. But how much is the company actually making from their sales? What are their margins?
Margins in the business
These include operating margins and operating cash flow margins. Consider the following graph presenting a comparison of Year End 2020 PS ratios and revenue for PayPal (PYPL), Mastercard (MA) and Visa (V).
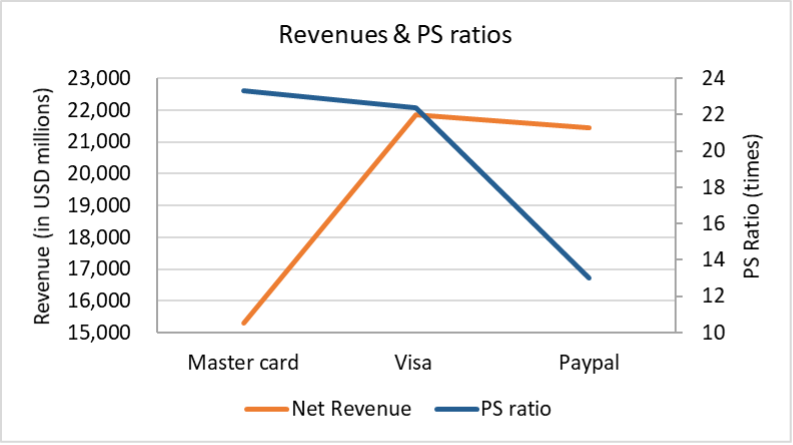
PayPal’s net revenues for FY 2020 are similar to Visa’s and 40% higher than Mastercard’s revenues. Why then is their PS ratio significantly lower? One reason is that the market currently undervalues PayPal. Their higher P/E ratio indicates the potential for positive future performance. For a counter argument, let us consider the graph below that plots the PS ratios against the margins:
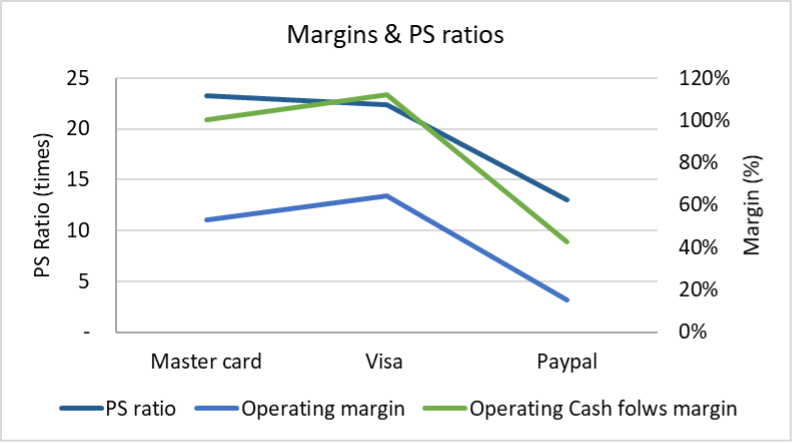
PayPal’s operating income and operating cash flow margins are significantly lower compared the Mastercard & Visa’s. When compared to Paypal, operating income margin is 3-4 times higher for Mastercard and Visa. And, operating cash margins are twice as high.
According to their annual filings, PayPal saw a 21% increase in total operating expenses compared to 2019. A result of an increase in transaction, technology and development, sales and marketing, G & A expenses, and transaction & credit losses. Acquisitions of Honey and GoPay reduced their operating margins by 3 percentage points.
Competitive advantage
These are factors that allow a company to produce its goods and services more efficiently compared to its peers. Efficiency translates to better quality, effective distribution and customer service, lower costs, rapid sales growth and larger margins. PayPal margins can improve if it can sustainably diversify and scale while keeping operating expenses in check. As a result, their multiples could align with or converge to those of the larger payment services in the future.
Comparing Price to Sale Ratios across companies
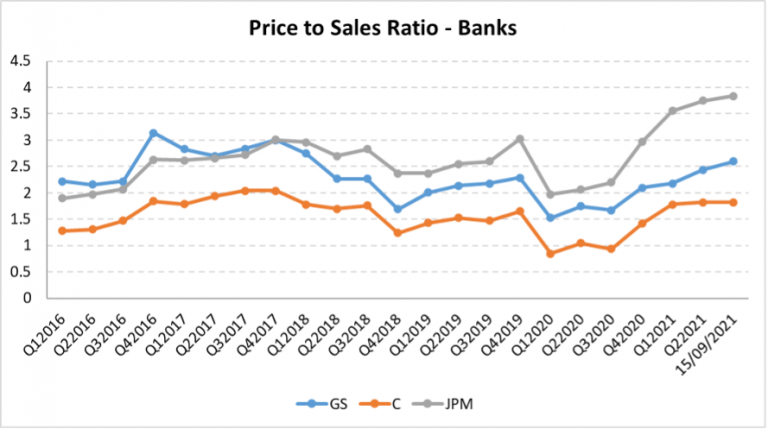
The range and level of PS ratios for different sectors and industries varies. Hence, when benchmarking a company’s performance, it is important to compare metrics of similar companies within the same industry. The historical series of ratios for banks & payment services are given below. The data was sourced from www.macrotrends.net:
Banks
Price to sales ratios for the banks assessed below lie between 0.8 to 3.84 times over the period 2016-2021. It would take between 1-4 years for the sales to equal market capitalization. Alternatively, investors would be paying $1-4 for every dollar generated in revenue.
In comparison, over the same period for payment services we find a much wider range. Minimum PS ratios are around 5 times and maximum ratios are 25 times sales. At the upper bound, investors would be paying a whopping $25 for every dollar of revenue.
Payment services
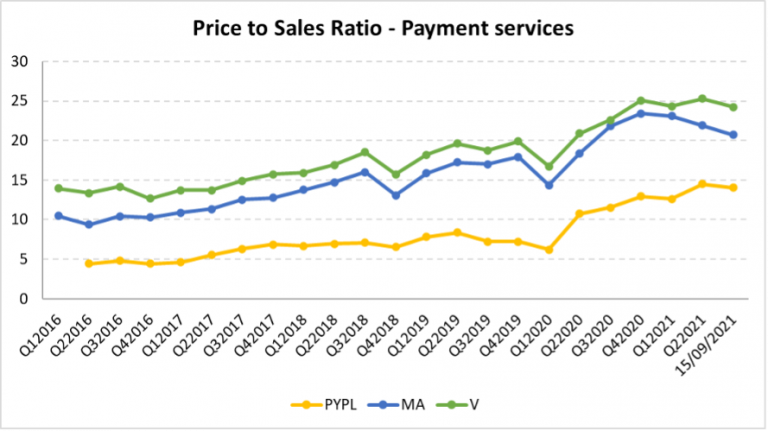
You may notice that in general the trajectory of the PS ratios within an industry is in the same direction. Also, the ratios for mature entities within the industry tend to converge.
Usefulness in negative earnings scenarios
PS ratio is useful for assessing start-ups, loss making companies or companies going through periods of recovery. In such cases, the earnings for the period are negative. Hence, profitability ratios, like the price to earnings ratio, return negative results. The PS ratio instead can provide insight and confidence to investors evaluating the growth potential of these companies. In fact, the PS ratio is often used as an early predictor of growth.
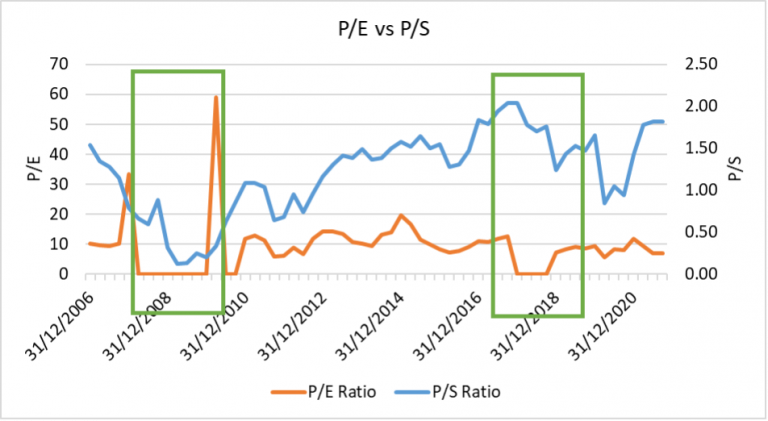
The green boxed areas in the graph above show periods of negative earnings for Citigroup. While the resulting negative PE ratios (floored at zero) in these periods are meaningless, the PS ratio yields valuable information. Growth & recovery potential. This reflects the stability of using sales or revenue rather than earnings in the measure. Earnings are sensitive to the market panic and the economic and industry environment. Sales, on the other had is relatively stable over time. In addition to this advantage, accounting treatments and practices are less likely to affect sales. They are less susceptible to manipulation. Aggressive accounting practices and decisions can influence earnings. Especially, when companies come under pressure to meet publicized targets leading to distortions in reported earnings.